-
AuthorSearch Results
-
August 1, 2024 at 9:54 am #9902
In reply to: Forex Forum
August 1, 2024 at 9:46 am #9901In reply to: Forex Forum
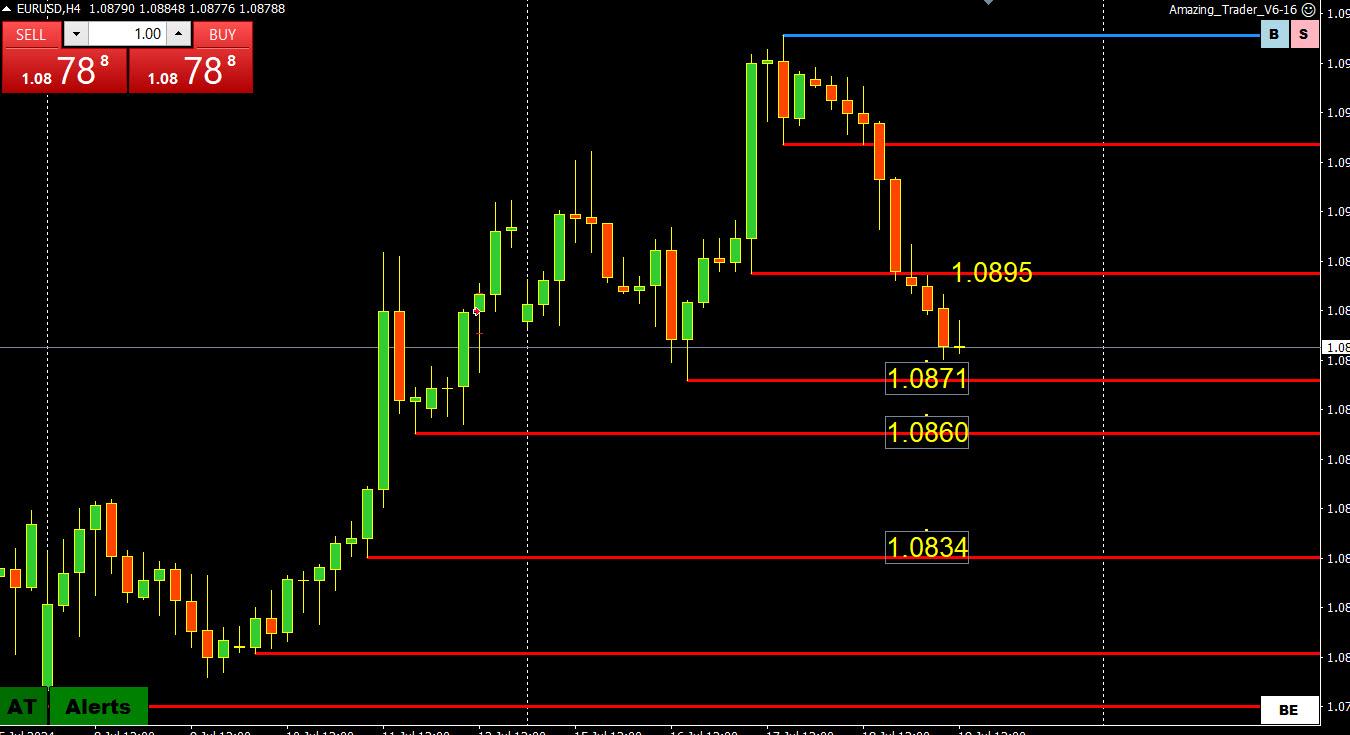
EURUSD DAILY CHART – THE ONLY LEVEL TO WATCH
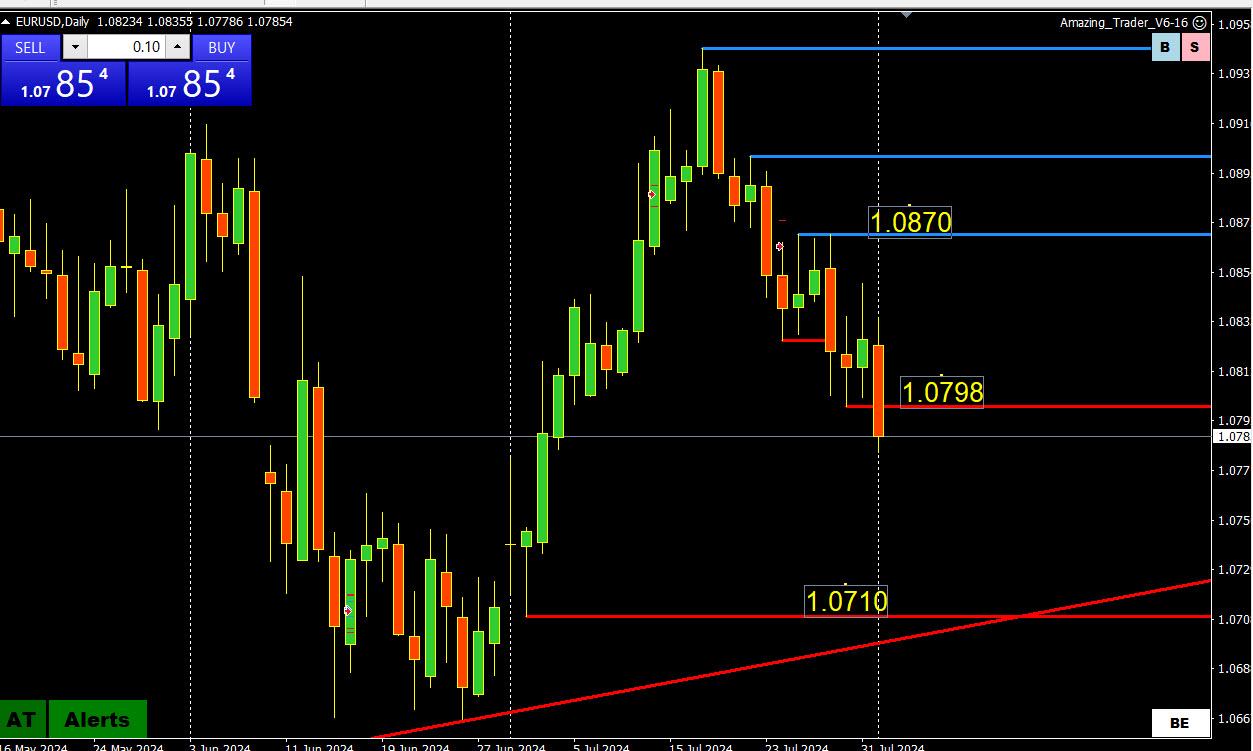
EURUSD following the weaker GBPUSD with a lag and for me, the only level to watch is 1.08 as this will set the tone going forward.
There is little on a daily chart until 1.0710.
On the upside, the failure to take out 1.0850 set the stage for a fresh run lower.
Note the blue Amazing Trader lines indicating risk on the downside as long as it stays below 1.0870
August 1, 2024 at 9:37 am #9900In reply to: Forex Forum
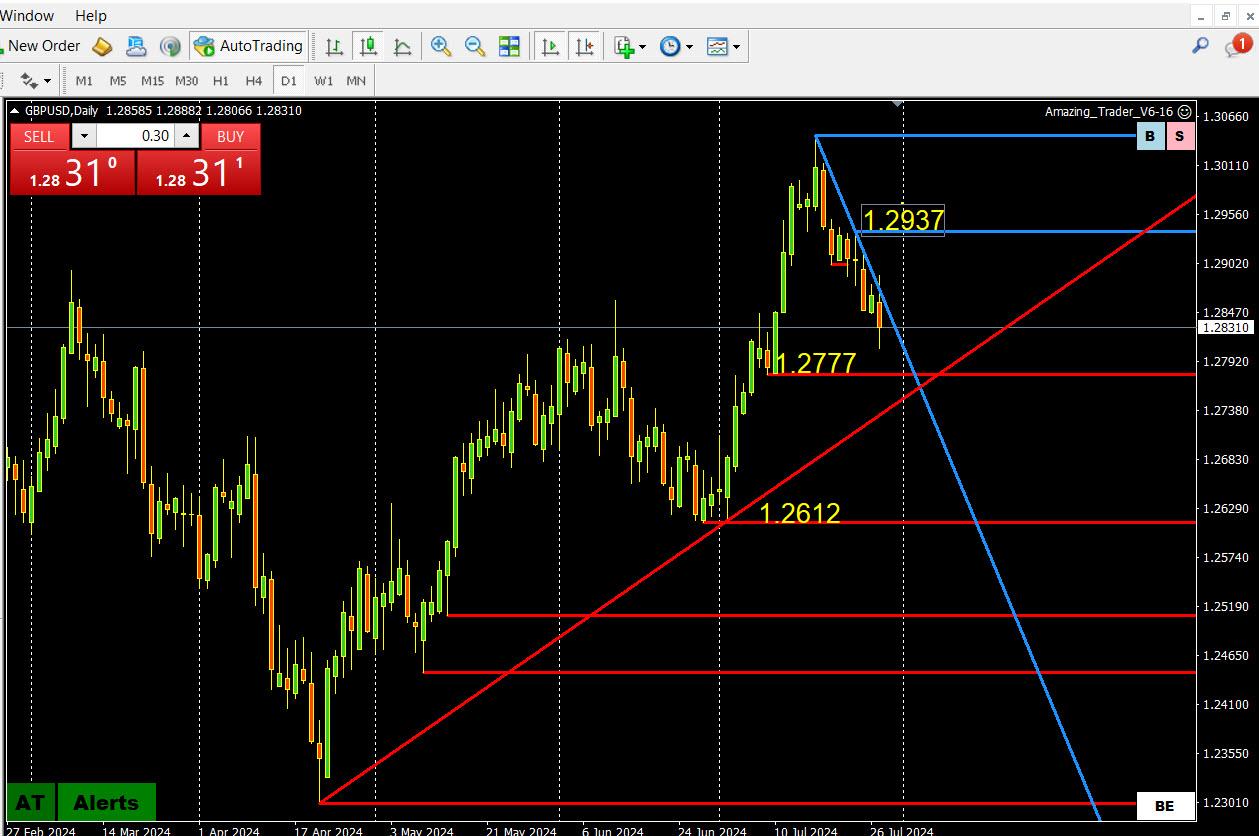
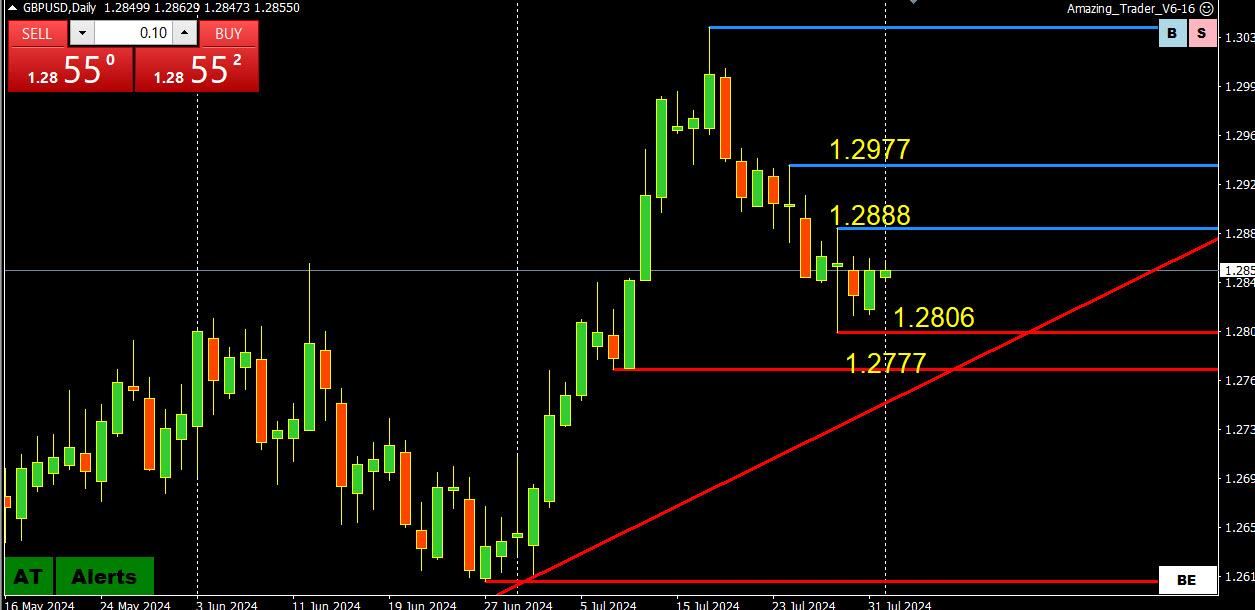
GBPUSD DAILY CHART – BOE SET TO CUT RATES?
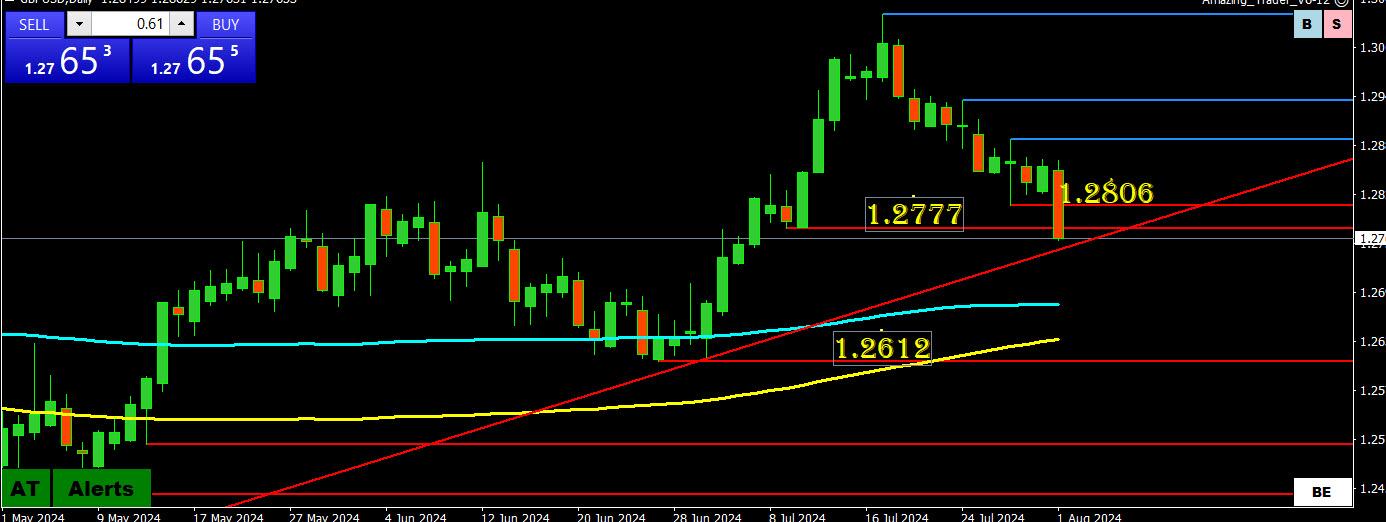
GBPUSD moving off the sidelines as price action suggests market is voting for a rate cut today.
Break of 1.2777 is significant if it holds.
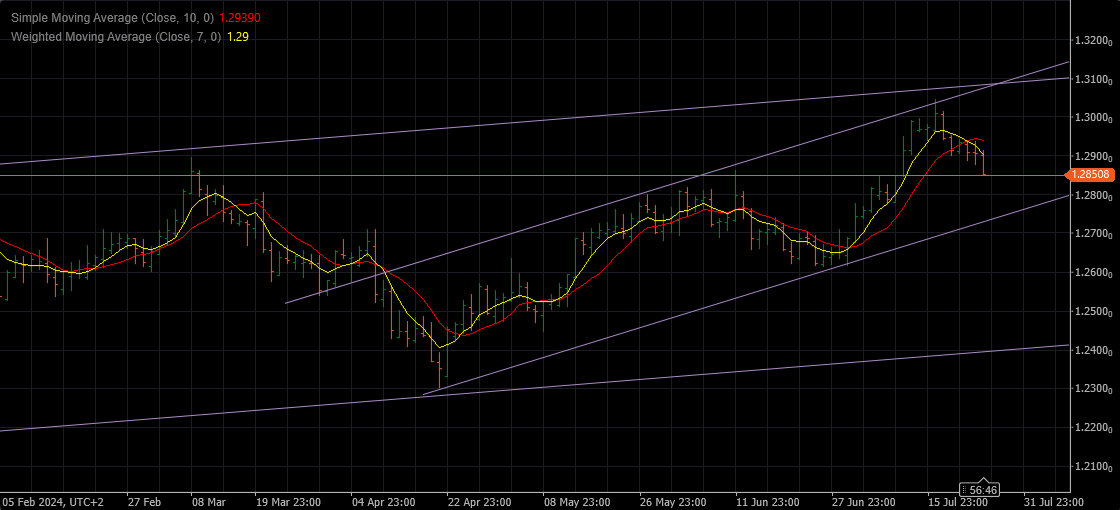
Key daily trendline is around 1.2750.
Still above but coming closer to 100 (blue) and 200 (yellow) mvas.
Major level us 1.2612, the base of the move to 1.3044.
July 31, 2024 at 11:40 pm #9893In reply to: Forex Forum
July 31, 2024 at 11:40 pm #9892In reply to: Forex Forum
July 30, 2024 at 11:49 pm #9825In reply to: Common Sense Trading
How You Can Use Currency Crosses to Trade Spot Forex
If I told you that there was a large order in the market to buy EUR and sell GBP would you be looking to sell EURUSD and buy GBPUSD, do the opposite or step aside as the order gets executed?
We are just outsiders in the forex market
As outsiders, we are not privy to the flows in the market. Due to increased regulation, banks that are executing the orders are no longer able to pass on information. In addition, the increased use of online platforms makes it even more difficult to get information on order flows.
As a result, all we are left with is guesswork. However, the price action in major crosses, such as EURGBP, EURJPY, GBPJPY, etc., can give a clue to the order flows driving the price action in respective currency pairs. The focus of this article is on how to use this information to trade spot forex.
What is a currency cross?
Before I go on to the current trading world, let me define a currency cross.
A cross is the relationship between two currencies. It is simple algebra. There are two variables and one product that do not directly involve the dollar as that portion gets netted out. In all cases, the dollar portion is netted out and you are left with one currency vs. another with no US dollar component.
Example 1: EURGBP is calculated by EURUSD/GBPUSD = EURGBP. Let’s say EURUSD is trading at 1.0650 and GBPUSD at 1.2450. Then 1.0650/1.2450 = EURGBP .8554.
Example 2: EURJPY is calculated by EURUSD x USDJPY = EURJPY. Let’s say EURUSD is trading at 1.0650 and USDJPY at 154.60. Then 1.0650 x 154.60 = EURJPY164.65
The difference in the calculations where we divided the two currency pairs in example 1 and multiplied in example 2 is the way each currency pair is quoted vs. the US dollar.
For example, EUR and GBP are quoted as dollars per one EUR (or GBP) while USDJPY is quoted as Japanese Yen per US dollar.
However, this does not mean, as you will soon see, that the dollar is not impacted by cross trades as the market has to go into and out of the US xurrency (as the case may be) to create the cross.
No longer a dollar-centric world
When I first started trading in the forex market it was a dollar-centric world. The dollar was the center of all transactions and currencies rarely moved in opposite directions from one another. Most times currencies moved in the same direction in line with the prevailing dollar trend but not necessarily at the same pace. For example, if there was a EURGBP sell order and the dollar trend was up, both EURUSD and GBPUSD would both move down but the EURUSD might move farther and faster than the GBPUSD
Now, we no longer live in a US dollar-centric trading world but a multi-currency world. What I mean by that is while the dollar is still the dominant trading currency, cross-currency flows have become a large part of forex trading and more often than not drive the spot market. It is not unusual to see two currencies move in opposite directions direction against all currencies.
How to take advantage of crosses to trade spot forex
So, the question is how do you take advantage of cross flows, even if you do not trade the crosses directly? In other words, you do not have to trade the crosses to use them to your advantage in trading a spot currency, such as EURUSD or GBPUSD.
Let’s say there is a flow in EURGBP to buy EUR and sell GBP in a market where the overall dollar trend in both is up. By looking at EURGBP, you may assume there is buying of EURUSD and selling of GBPUSP to execute an order. In this example, the overall dollar trend is up but more so vs. the GBP than vs. the EUR. The EURUSD initially trades higher and GBPUSD tries to follow as the order gets executed. The EURUSD buying is easily absorbed as there are willing sellers as the trend is down ivs. the dollar. Once EURUSD hits resistance, the GBPUSD sell component of this flow takes over and GBPUSD falls sharply.
Why? The answer is that the market has less capacity to absorb the GBPUSD selling than the EURUSD buying to execute the buy order in EURGBP. Once the order is completed and/or EURGBP meets resistance, EURUSD will lose its cross-related bid.
If the EURUSD was in a strong uptrend and that was the dominant side, GBPUSD would have initially dipped but would not have gone that far. EURUSD demand out of this cross-flow would have then taken over and pushed it higher as that was the side where flows were less easily absorbed.
As we all know, trading rarely works like a textbook but in this simple example, you can see how crosses can give a clue to trading spot fx. They tell you what flows are going through the market in what can often look like a tug-of-war with respective currencies pulling in opposite directions. When the dollar trends are mixed, you can see currencies trade in opposite ways with the dollar only acting as an intermediary. As a general rule, one currency will have less capacity to absorb the flows and this is the side of the cross-trade that tends to be most vulnerable.
One way to confirm that there is real money driving a cross is when two currencies move in opposite directions vs. the dollar.
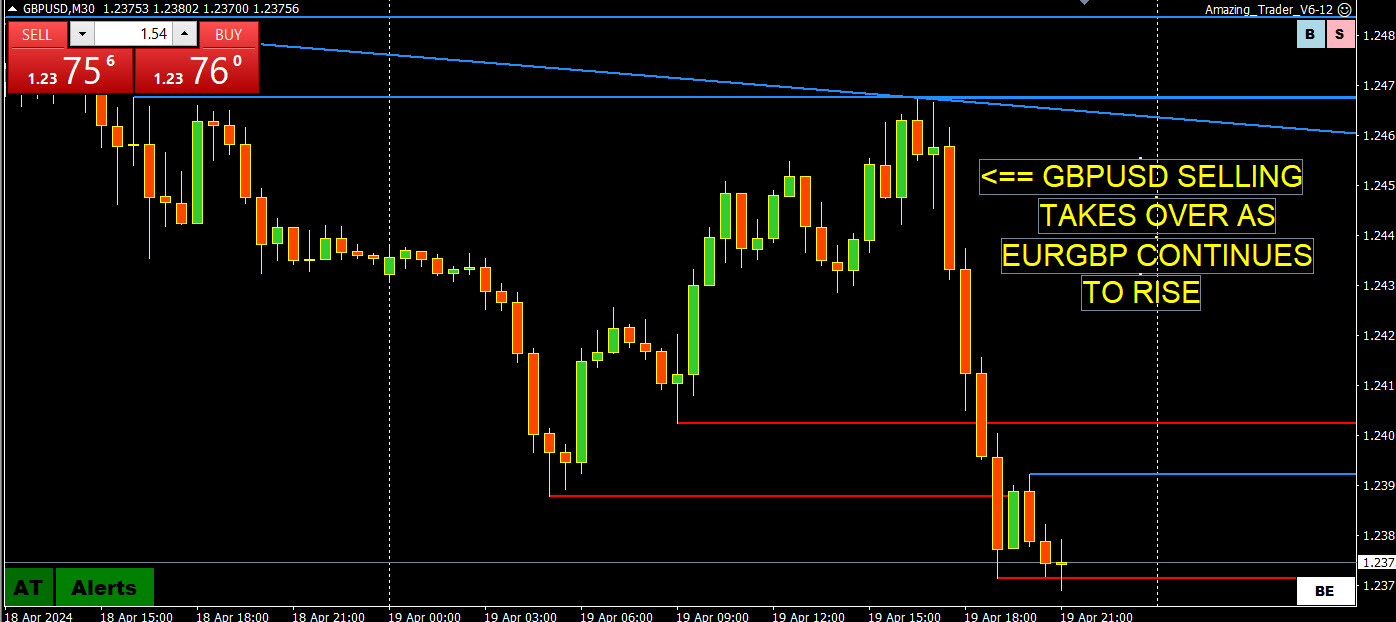
Real-time illustration
Here is a real-time illustration from April 19, 2024, where a move up in EURGBP has a greater impact on GBPUSD (sell) than EURUSD (buy)
EURGBPUSD MOVES HIGHER
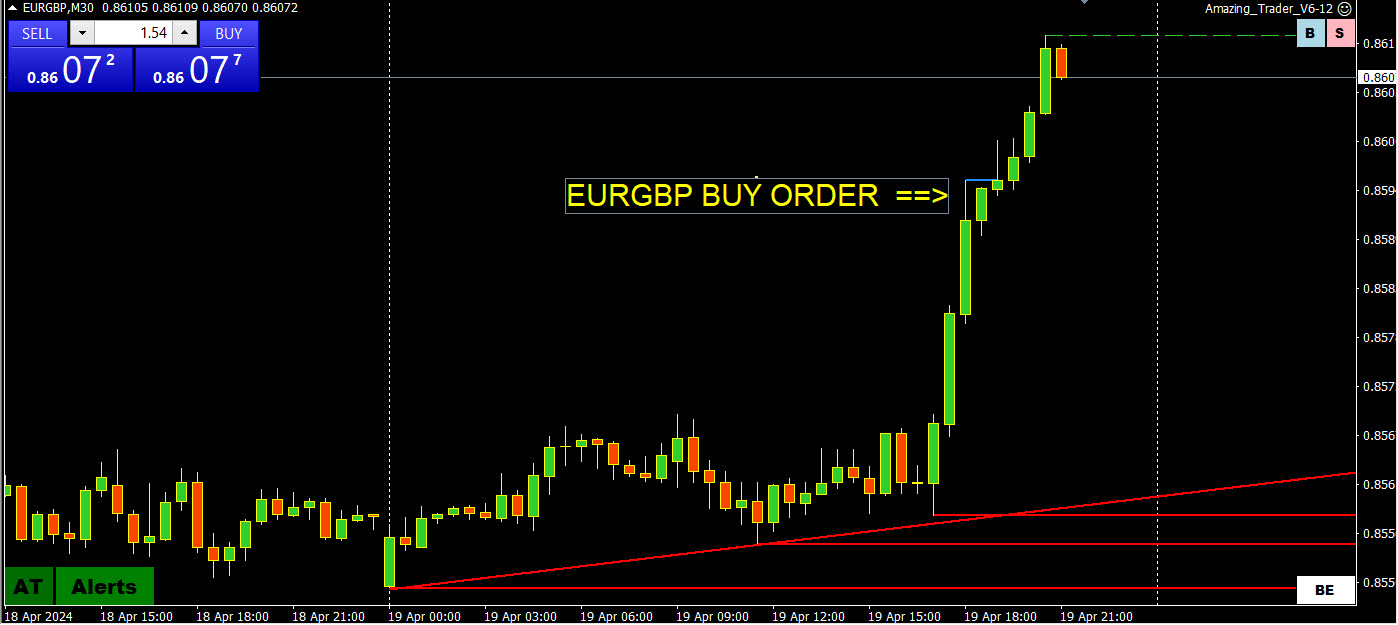
EURUSD TESTS UPSIDE AND THEN STALLS
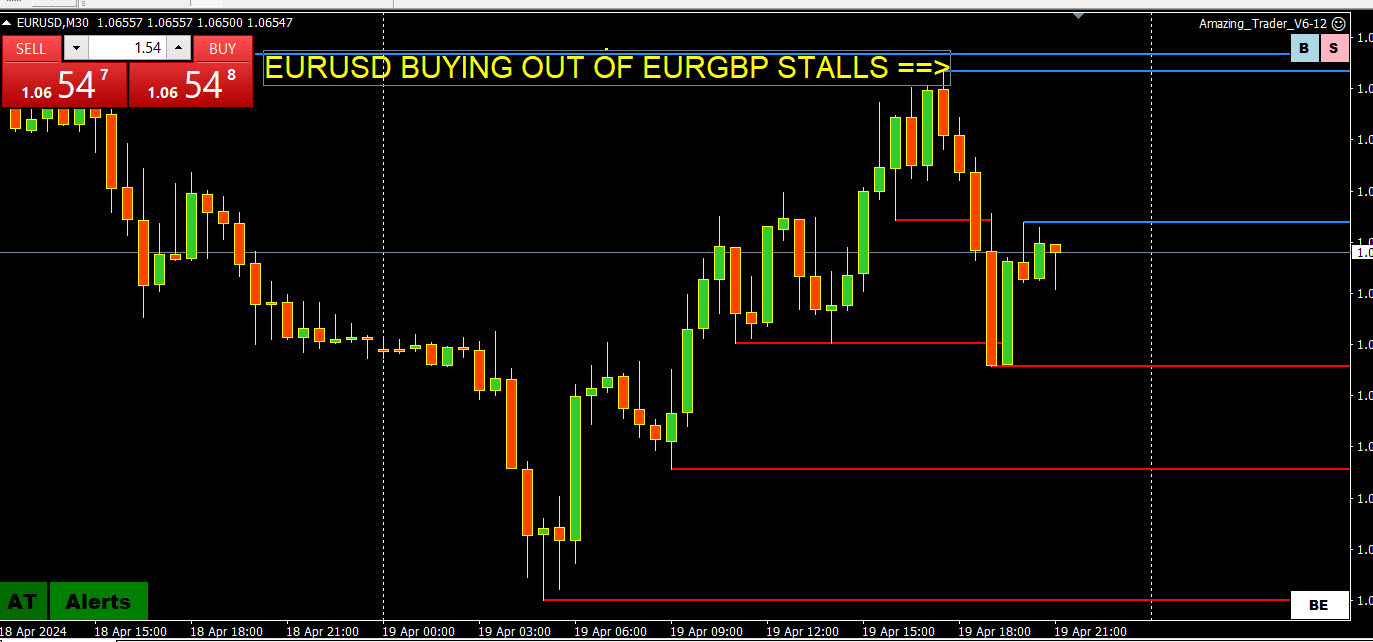
GBPUSD SELLING TAKES OVER
So, let’s conclude with the same question I asked initially:
If I told you that there was a large order in the market to buy EUR and sell GBP would you be looking to sell EURUSD and buy GBPUSD, do the opposite, or step aside as the order gets executed?
This just scratches the surface but should give you an idea of how to use crosses to trade spot forex.
Feel free to contact me with any questions or comments.
July 29, 2024 at 5:31 pm #9763In reply to: Forex Forum
July 29, 2024 at 10:12 am #9734In reply to: Forex Forum
GBPUSD DAILKY CHart – POSTED IN THE GLOBAL-VIEW TRADING CLUB WEEKLY CHARTS
The key event will be Thursday’s BOE decision where a rate cut is possible in what will be a close call.
1.28-1.29 is the current range with THE KEYBTREBDLKINE AND retracement level below 128 and 1.30 on the radar if above 1.30.36
1.2777 SUPPORT IS ALSO 61.8% OF 1.2612-1.3044 SO THE LEVEL THAT NEEDS TO HOLD TO MAINTAIN HOPE THAT THIS IS A RETRACEMENT.
July 25, 2024 at 8:04 pm #9661In reply to: Forex Forum
July 23, 2024 at 12:49 pm #9521In reply to: Forex Forum
July 23, 2024 at 10:25 am #9508In reply to: Forex Forum
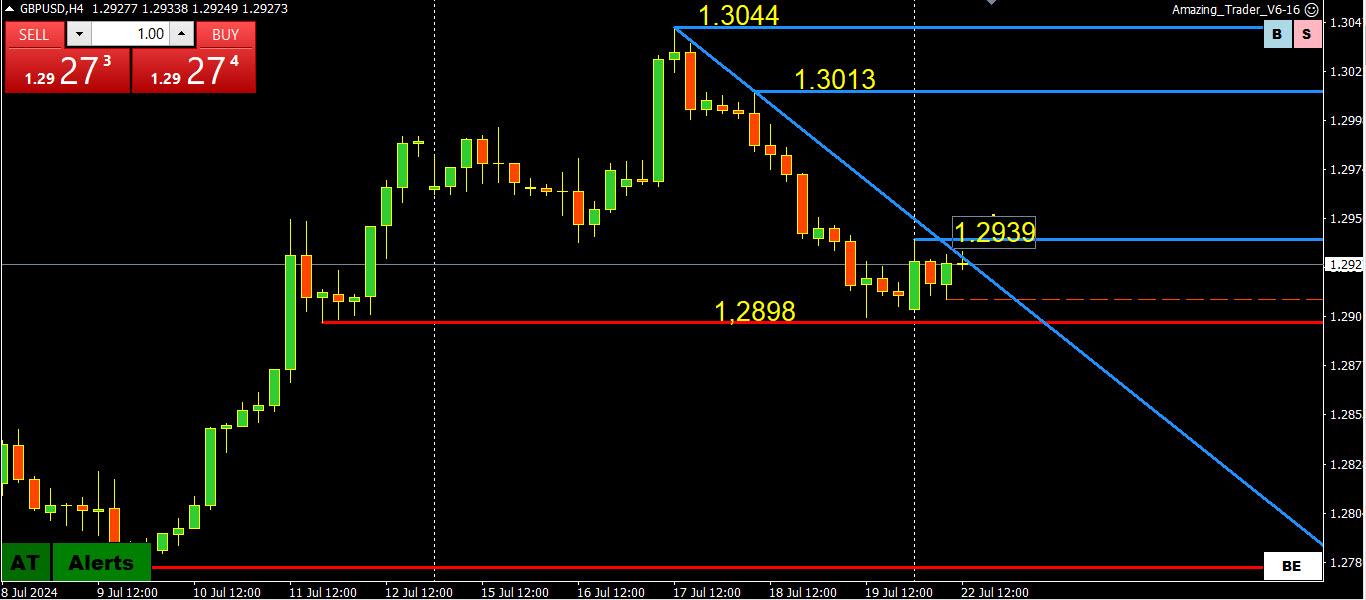
GBPUSD DAILY CHART – STILL A RETRACEMENT?
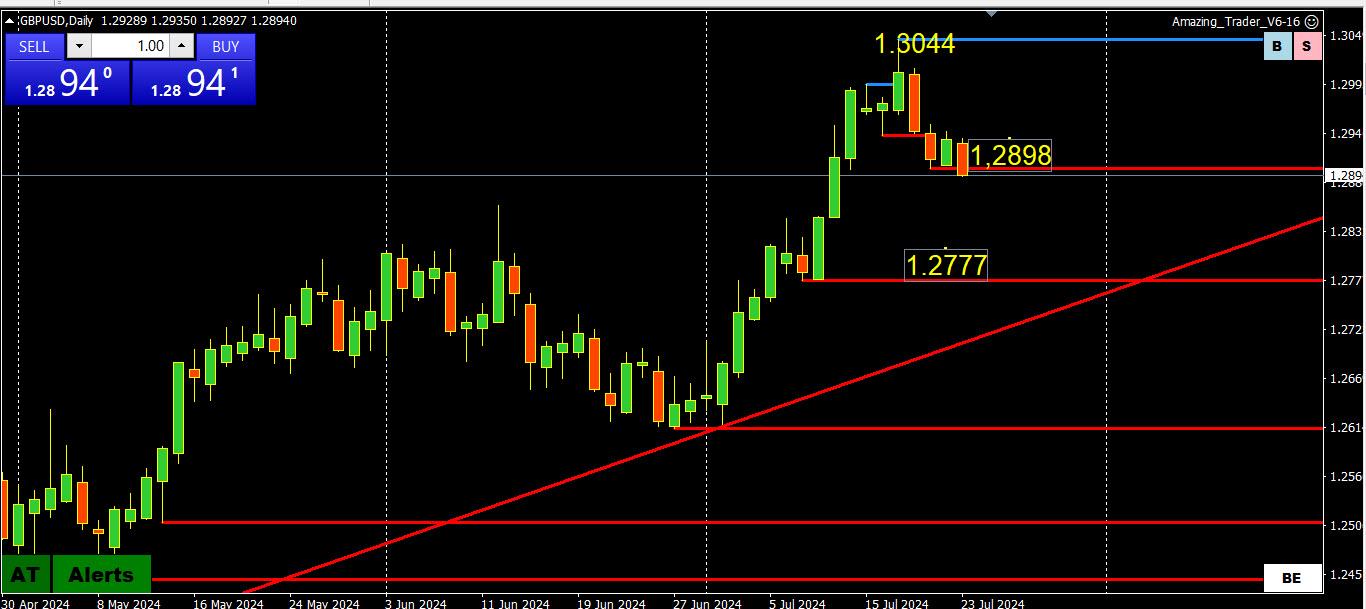
if looking for potential levels of support/targets if the 1.2898 break holds.
Using 1.2612-1.3044
1.2879 = 38.2%
1.2838 = 50%
Looking farther out, 1.2777 and the major trendline are still out of range.
July 22, 2024 at 10:06 pm #9494In reply to: Trading Academy Q&A’s
July 22, 2024 at 8:47 pm #9487In reply to: Trading Academy Q&A’s
July 22, 2024 at 11:36 am #9457In reply to: Forex Forum
GBPJPY 1 HOUR CHART – KEY LEVELS
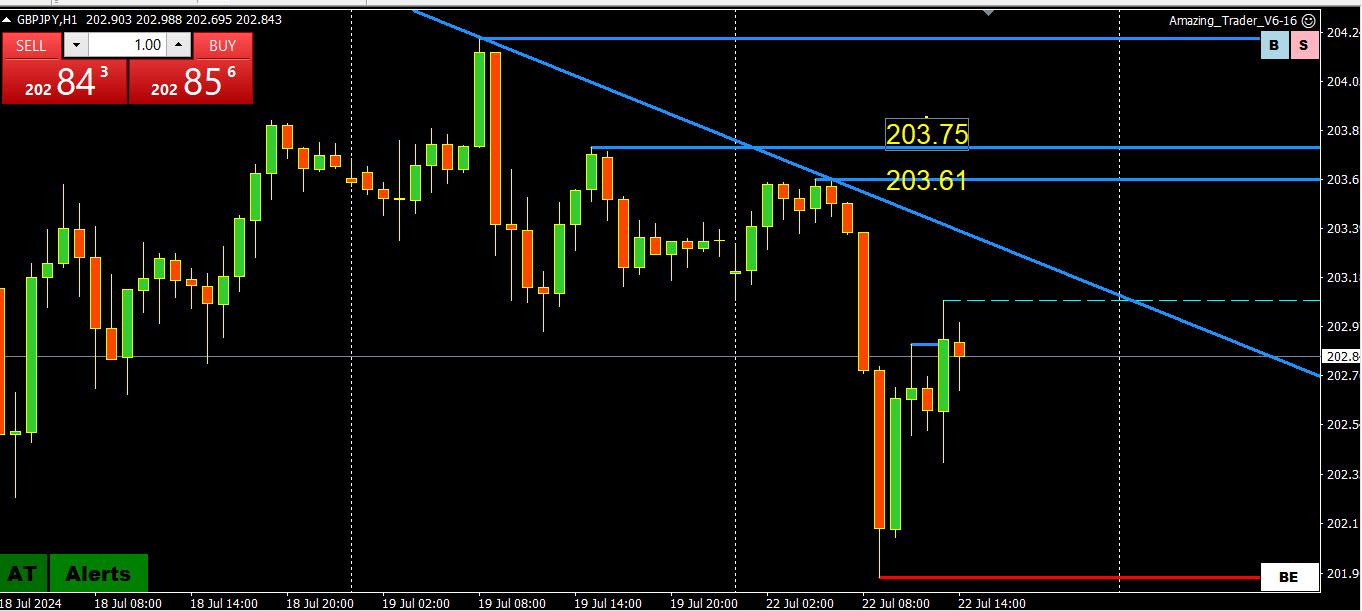
KEY LEVELS TO CONFIRM THE LOW IS IN AND SHIFT IN RISK REQUIRES A BREAK OF THE TRENDLINE AND BREAK ABOVE 203.60-75
GBP IS GETTING SOME OF THE CROSS FLOWS, INCLUDING VS THE JPY, AS THE FOCUS STARTS TO LOOK AHEAD TO THE END OF MIONTH BOJ MEETING ALTHOUGH NOT REFLECTED AS YET IN USDJPY (DOWN ON THE DAY).
‘
THIS CAME OUT A SHORT WHILE AGOBoJ is reportedly said to see weak consumption comp;licating its rate decision, according to Bloomberg
Source. Newsquawk.com
July 22, 2024 at 11:23 am #9456In reply to: Trading Academy Q&A’s
Yep too many Gurus out there…none of them survive as long as Jays Global View.So talking of flows, perfect example today of the relationship between Cable, Euro and EURGBP.
EURGBP dropping hard Cable rising, EURUSD static. Also look at the other GBP crosses GBP/Commodity crosses to see how GBP is being bid across the board.
But see EURAUD also rising hard, so we very weak AUD. Then glance to USDCAD and see that rising, so we have weakness across the Comm FX pairs. Its all connected.July 22, 2024 at 9:42 am #9449In reply to: Forex Forum
July 22, 2024 at 8:33 am #9446In reply to: Trading Academy Q&A’s
And that was one full explanation Alan 😀
We all have really different methods in trading , but the preparation, analysis and triggers are common – that cannot be avoided.
Just this early Europe, I did two trades on EURUSD , but I have someone trading with me as well – although a young blood , but promising one.
As I was nagging about grass growing, he went with GBPUSD – exactly same strategy, same trigger – and same result at the end J
That is all different ball game – it’s a team play….
July 19, 2024 at 3:15 pm #9375In reply to: Forex Forum
USDCAD 15 MINUTE CHART – DO YOU BELIEVE?
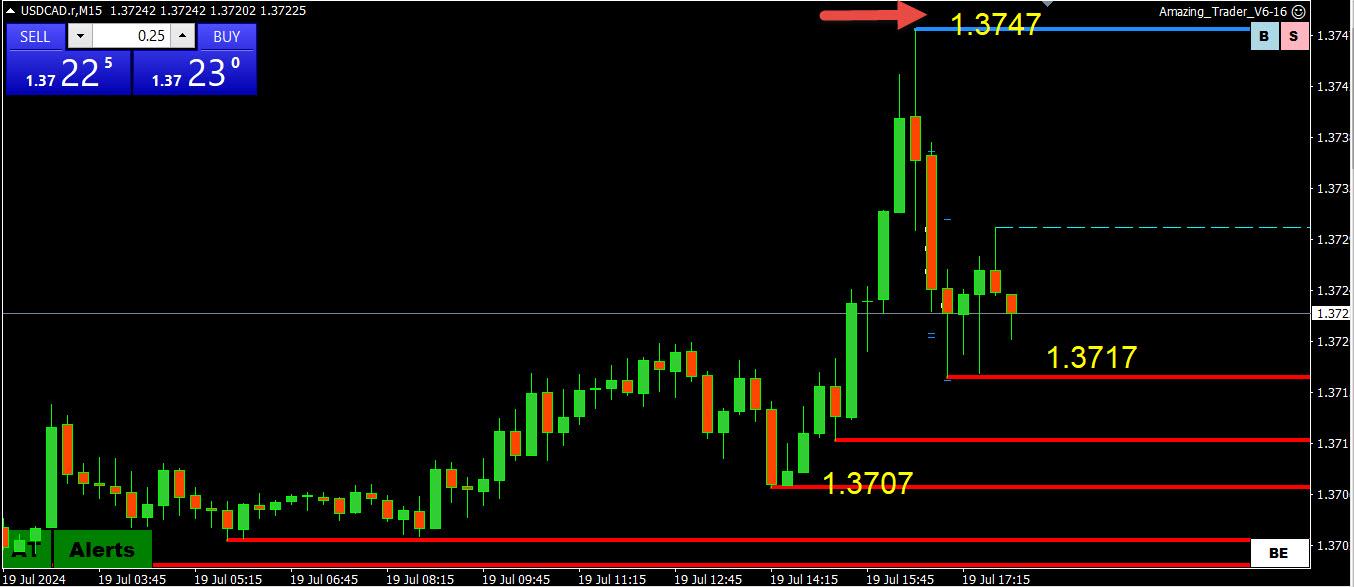
Another example of the Power of 50 as the pause below 1.3750 was followed by some book squaring that sent USDCAD back to pre-retail sales levels.
So, do you believe? This is just one indicator but it raised a yellow flag earlier this week after GBPUSD stalled below 1.3050 and EURUSD below 1.0950.
Otherwise, no change to what I posted earlier, which intra-day says expect support as long as it trades above 1.3707.
My Favorite Trading Secret: The Power of the 50 Level
 July 19, 2024 at 11:03 am #9358
In reply to: Forex Forum
Update:
EURUSD low 1.0876
GBPUSD low 1.2901
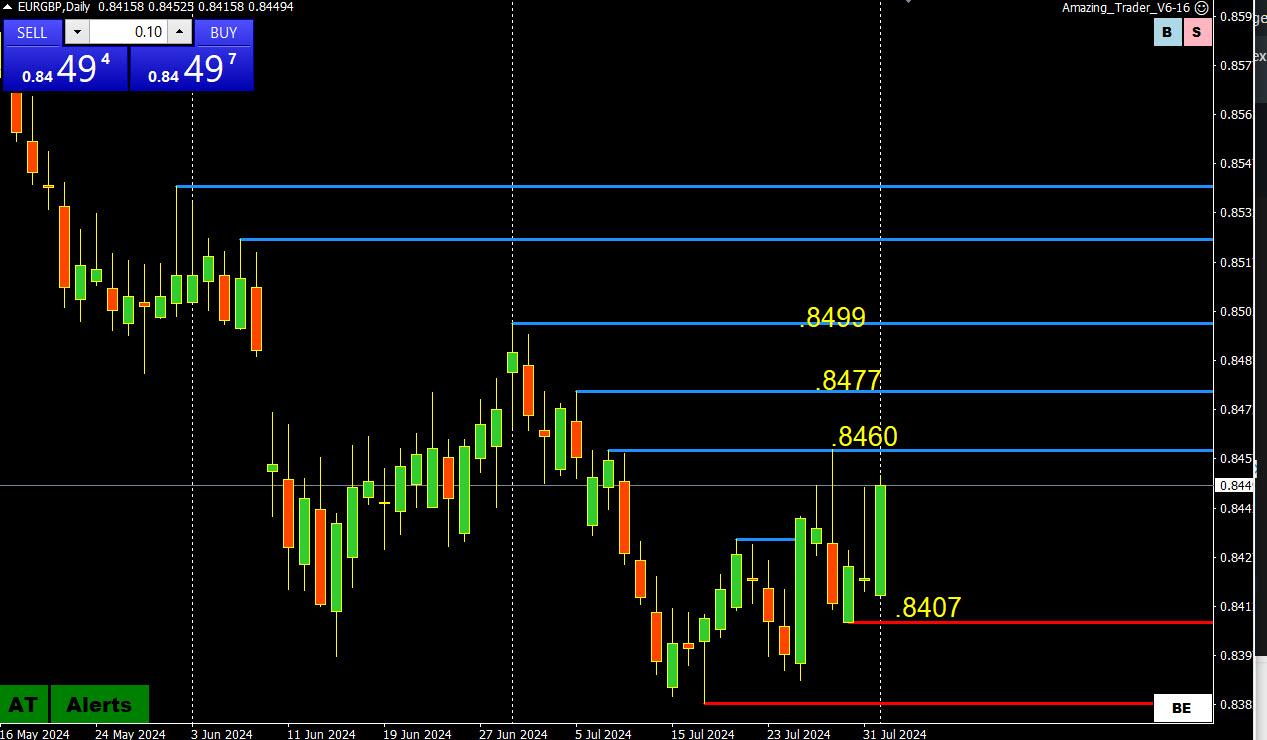
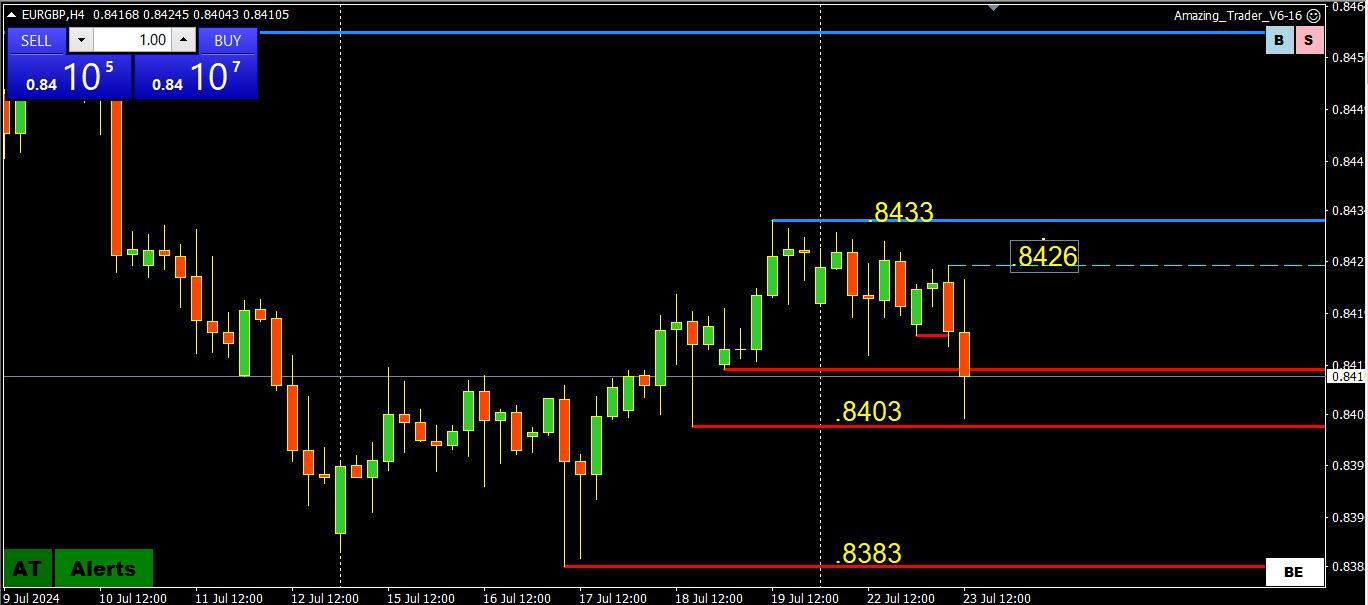
XAUUSD low 2310EURUSD high at .8432 is also an Amazing Trader resistance (last .8423)
July 19, 2024 at 10:06 am #9357In reply to: Forex Forum
-
AuthorSearch Results

© 2024 Global View