maybe it is boredom, like poking a stick in the coals of a barely smoking campfire at 2am …
see if it can be goaded into a flame to test the up-side next
1.2715 / 20 ?
What will be the outcome with relation to the riots in England to British Sterling?
how about pop n crack of hardwood on the skull to imporove behaviour ?
OR as report from say relatively “right” rag daily mail:
“Far-right protests fizzle out in the drizzle as tens of thousands of ordinary Brits crowd streets to silence the rioting thugs… who desperately try to save face by pretending ‘100 demo’ plans were deliberate LIES to waste police time”
and so …
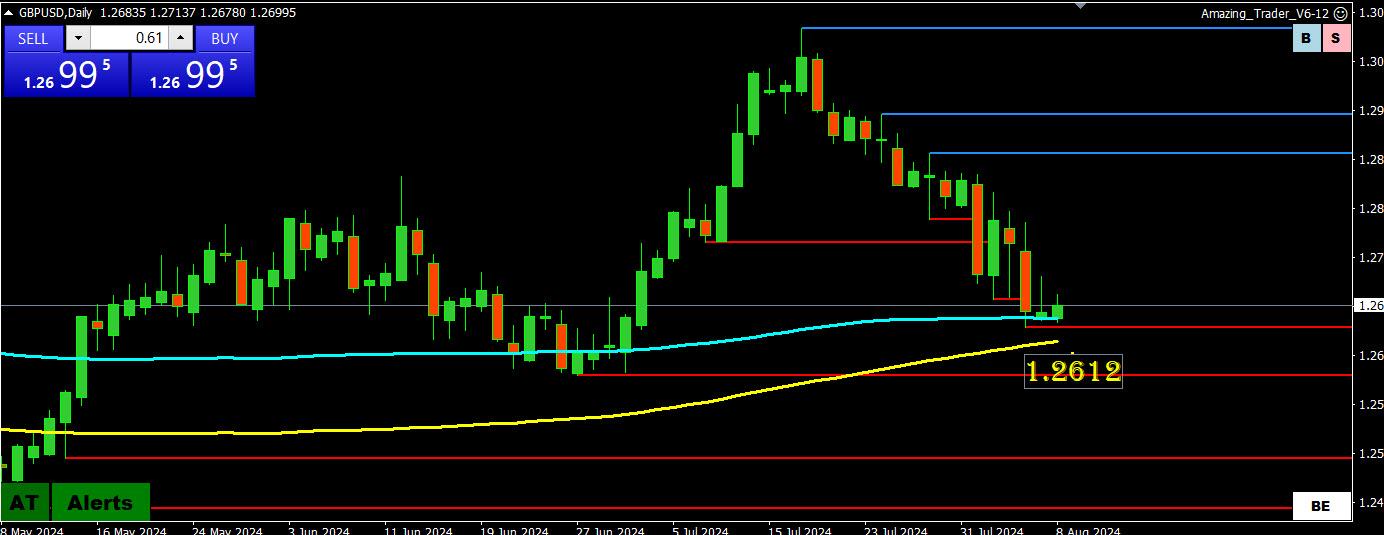
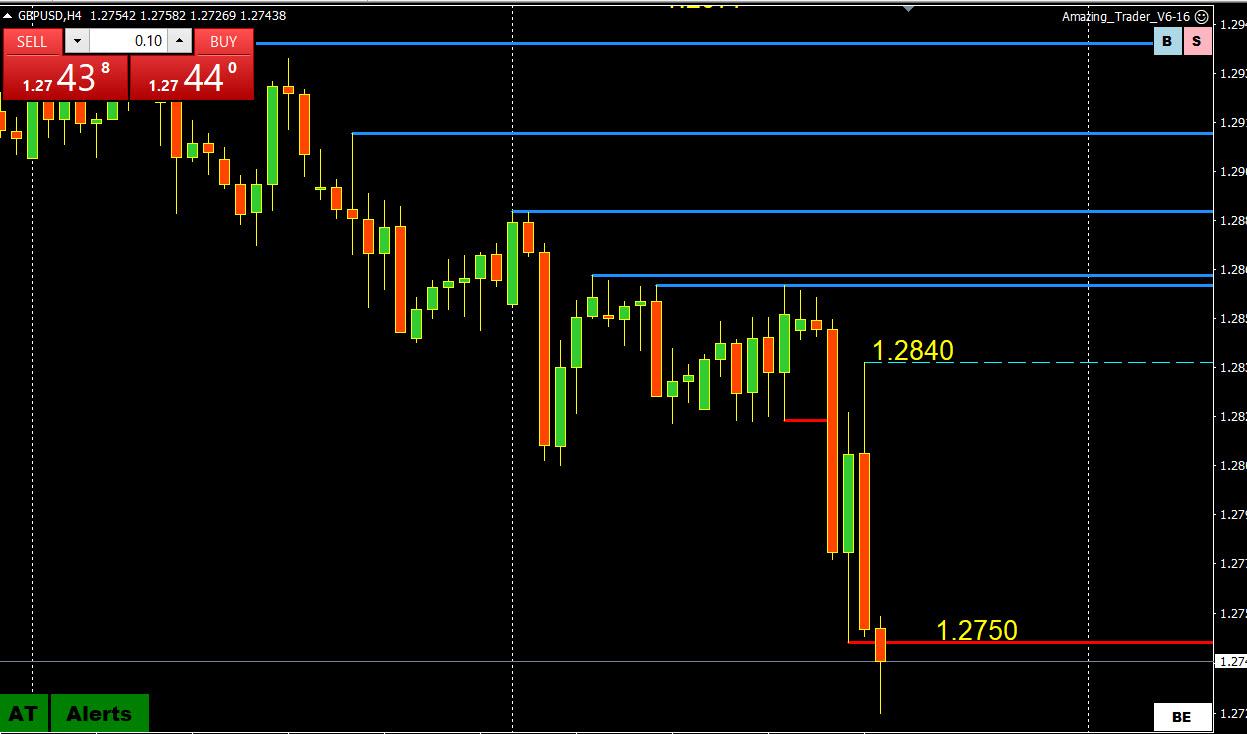
GBPUSD (1.269x) basically still stable around 1.27
As u know I am biased. Techs indicate niaah to bearish
In the s/t puppy’s trend is still down from earlier 1.3o-something.
I am expecting Sup around congruence of the 100 and 200dmas probably in the 1.2685 / 60 zone
I d get excited about the uP-side N of 1.2775 not holding Res.
– Add Channel/Parallel lines to these two extremes – Low and High – this can be just a channel widening , so for now treat it as such.
– As this is 15 min chart, extremes can come as a result of a bigger time frames, like 1h or 4h charts – so check it out
– So you did everything just fine – always expect additional mess…
Gold :
This one you draw perfectly !
I would just instantly add a parallel line ( of inner channel ) on those 3 previous lows – always look for extension possibility and pay attention did any bar closed below the support trendline or not.
As for taking a position – we’ll have to learn how to use these charts in our favour .
Sell was appropriate on the break of that inner trend line
In the current one way markets, the temptation to try and pick a top or bottom can be very strong. So, I am posting the article as a warning, one I learned many years ago the hard way and hopefully you will be able to avoid it. I suggst reading Bobby’;s Risk mangament update in the Trading Academy along with this article.
The Market Isn’t Your Enemy
One of my favorite articles I wrote as a warning to all traders is entitled, The Market Isn’t Your Enemy and it is worth repeating in the current market. I posted this (see below) several years ago to go along with the article and if it was today, I would not be surprised to see traders trying to fight the current trend the other way and sell the JPY with similar results. This is an article that has stood the test of time.
(November 2014)
I saw the trade recap of a trader I know for a long time, who I believe possesses good skills, and took a double take. I was really surprised by his trading sheet to say the least. It was last Tuesday when the JPY fell sharply. On that day, he lost on 13 consecutive trades either selling EURJPY or GBPJPY. You heard it right, 13 losers in a row until he finally gave up for the day.
While I cannot get inside his head, the trade recap suggested he lost discipline and got into a battle with a mindless market. It appears he fell into the trap I warned about in The Market Isn’t Your Enemy. It can happen to even experienced traders and for that reason I am repeating the article below for all to read:
The Market Isn’t Your Enemy
Have you ever had one of those trading days? Have you ever lost money trading and gotten mad at the market? Have you ever taken it personally, lost discipline and tried to convince yourself the market is wrong? Did this make you feel like the market was your enemy? Did this have you fight the trend in order to beat the market only to see your efforts repeatedly stopped out? This has probably happened to most traders at one time or another but it is not something you want to repeat.
The market is not your enemy. It is not a living organism although sometimes it might feel that way. The market is just a place where trades are transacted. Price action may sometimes seem illogical, even irrational but the market is never wrong as it does not have an opinion. It is only a place where forex rates are set. It is the collective will of those trading the market.
There is a term used in forex trading, the trend is your friend. When you catch a trend right, there is little stress, especially if you manage stops so that there is no risk of a loss. When you fight a trend, the market may feel like your enemy if you make it a battle of wills, yours against a place that has no will or opinion. .
Now, this is where the “market is my enemy” can take over. You can’t believe the market is acting irrationally and keep selling at every pause. Each time you get stopped out you get angry, not at yourself but at the market. You can’t believe the market is doing this to you and stiffen your back. You forget about what charts are saying, throw discipline out the window and become determined to catch the top by selling when charts are telling you to buy. By the time the move stalls out, you are beaten, having taken your lumps in what has been an emotionally draining day battling with an unemotional market. The market corrects without you on board.
Does this sound familiar? If so, then don’t repeat it. Step back when that feeling comes and take a deep breath. Walk away and come back with a clear head. Remember, the forex market is not your enemy. It is not a living organism. It is only a place where trades are transacted and prices set. When that feeling comes, remember the adage, “the market can remain irrational longer than you can remain solvent.”.
US coming in has seen some risk on => US bond yields fall => USD follows down except USDJPY, which is higher (suggests unwinding of some long JPY crosses)
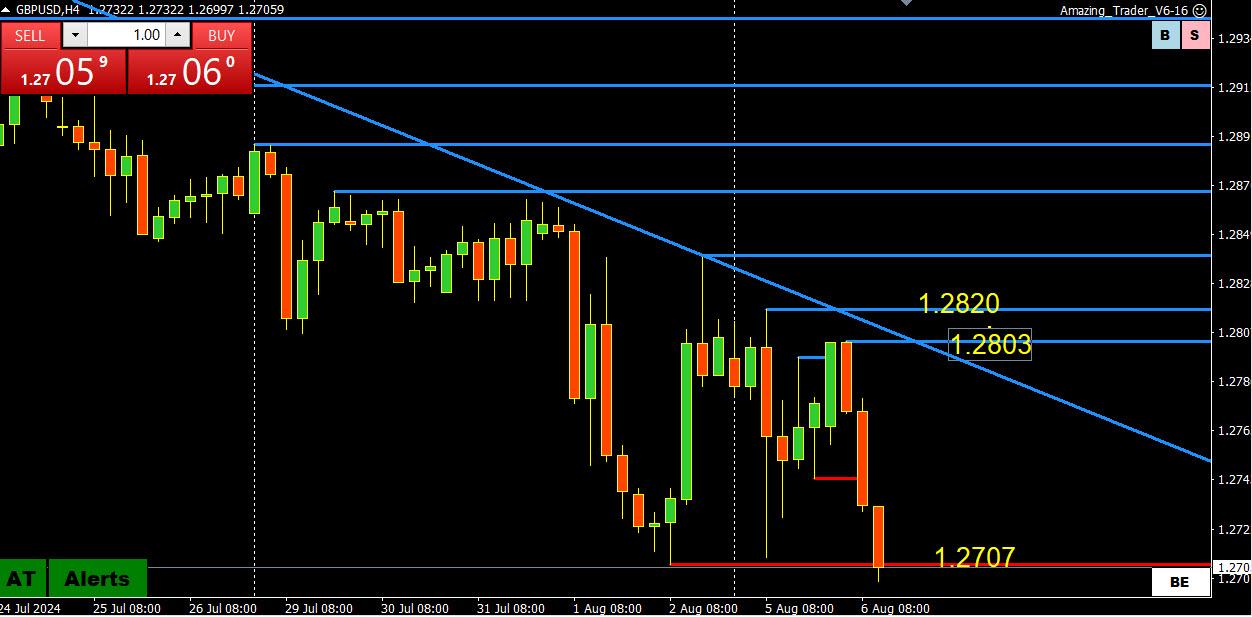
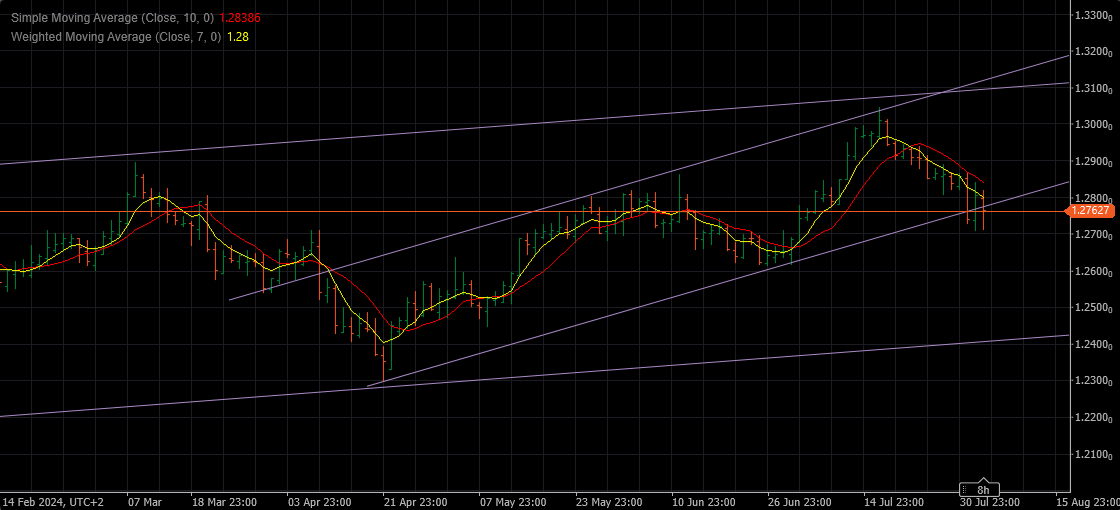
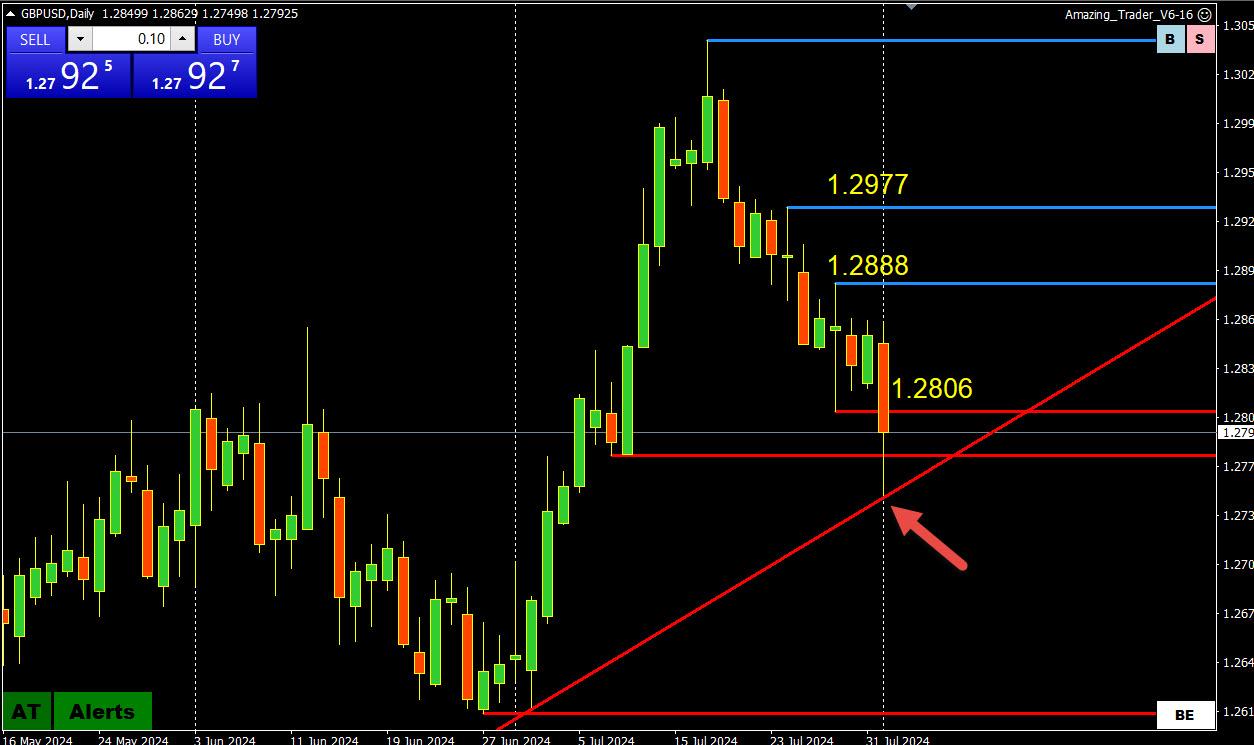
See this daily chart updated USING MY AMAZING TRADER CHARTING ALGO from the one I posted earlier (SCROLL BELOW) showing the key daily trandline has been tested
Bounce woud need to recover 1.2800-06 and stay above to suggest a low/pause.
I created The Amazing Trader and am still amazed when I see one of its lines, in this case a trendline, hold dead on.
Author
Search Results
Viewing 20 results - 521 through 540 (of 851 total)