This came to mind this morning after I nailed the direction and support yesterday (1.0945-50).
Looking across all currencies, the NZD is the big loser (-1.1%) while EURUSD is the outperformer, up while GBP and JPY are down vs. the dollar, providing demand for EUR out of its crosses.
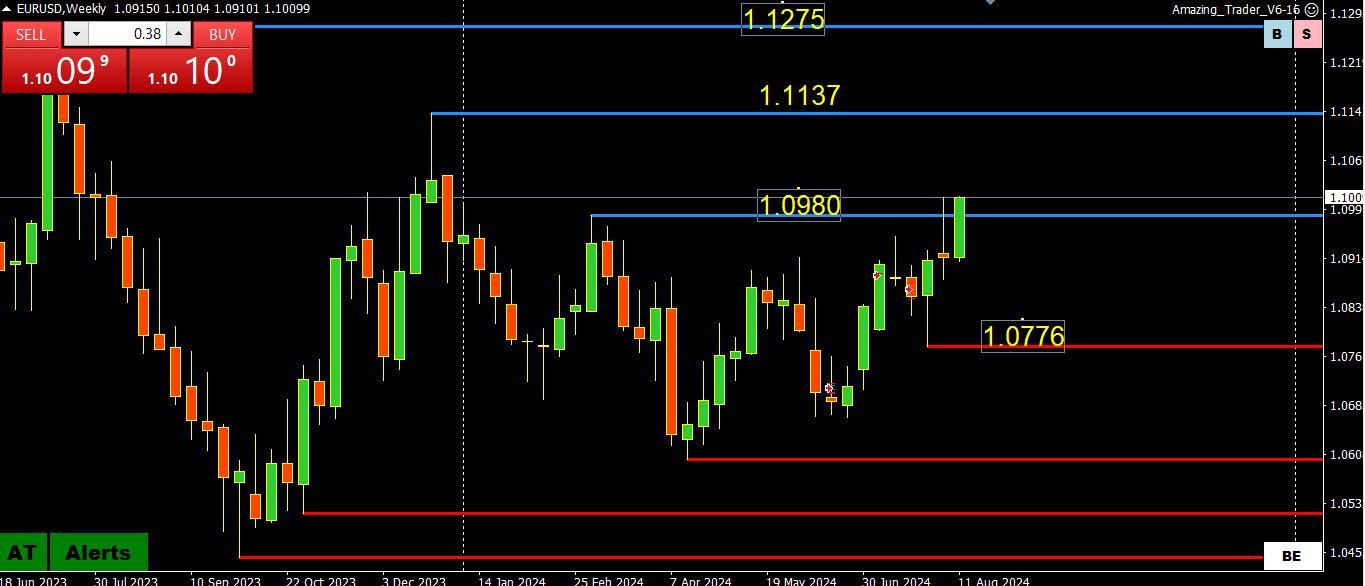
EURUSD
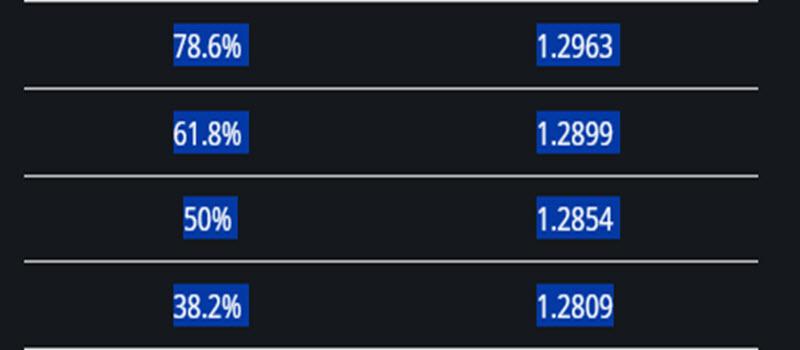
The only level that matters is 1.10 as it just broke its 1.1008 daily resistance with key levels beyond it shown on this chart. I the absence of key nearby levels, 1.1020-50 is a potential resistance zone.
The support zone is 1.0980-00 and 1.0945-50/
Next key focus is on US CPI… tone will be set by 1.10 post-data
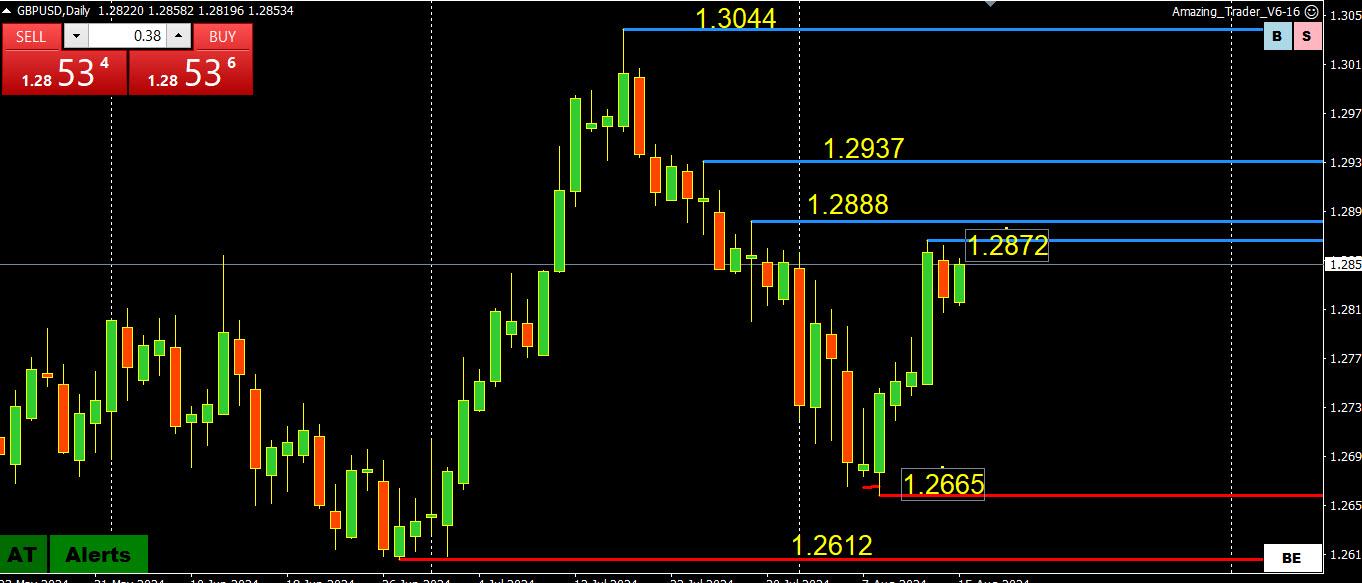
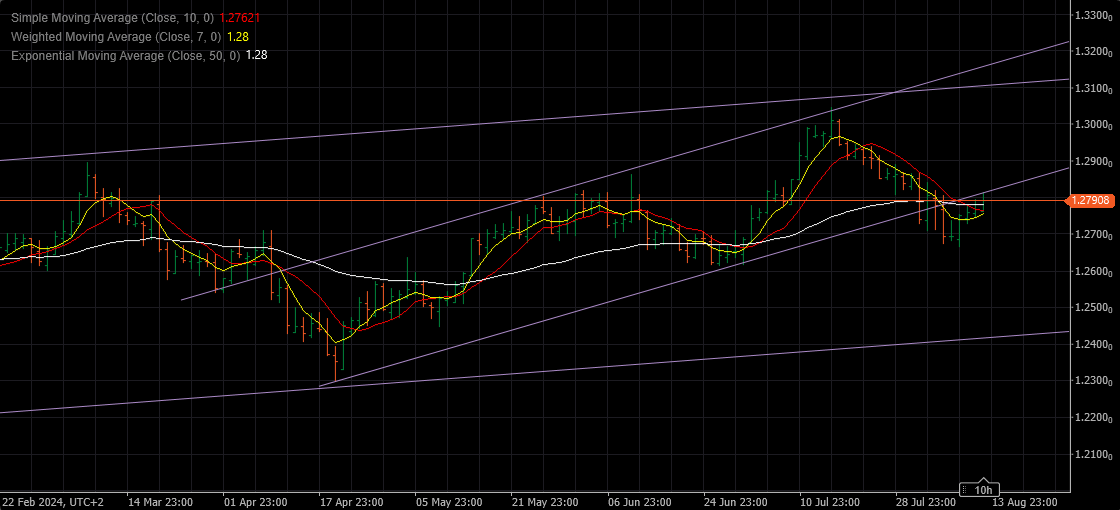
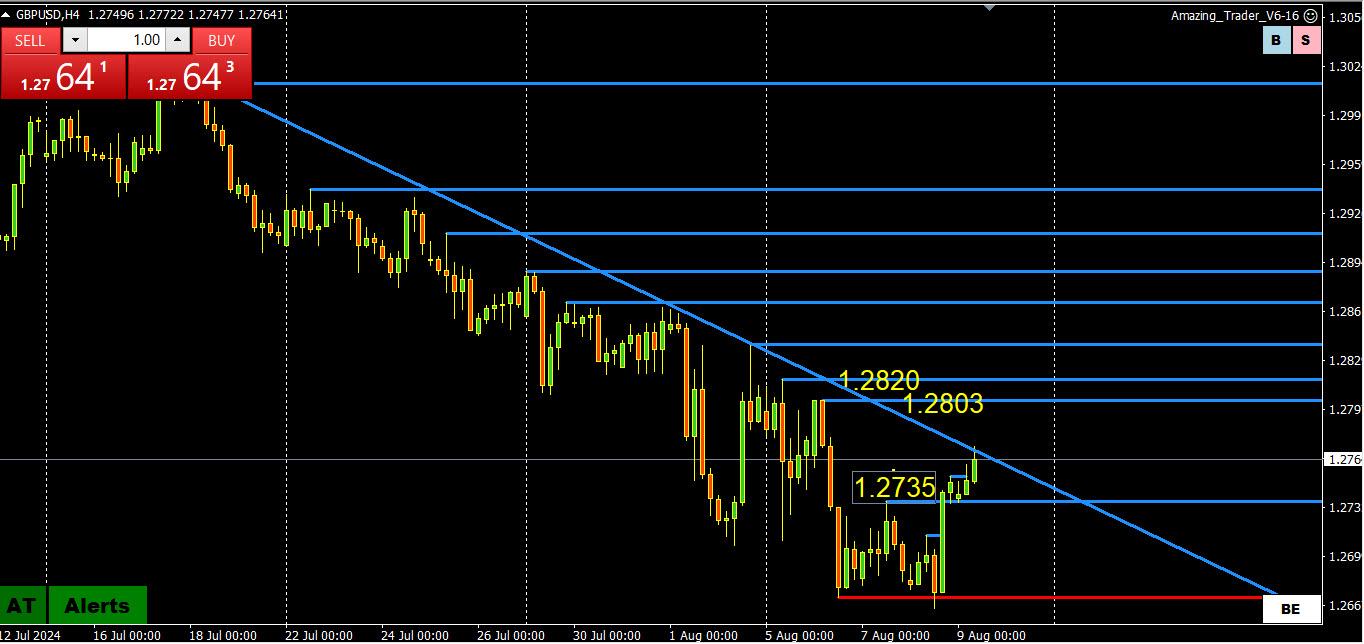
GBPUSD WEEKLY OUTLOOK – MOVING AVERAGES CHECK THE DOWNSIDE
Posted over the weekend (daily chart)
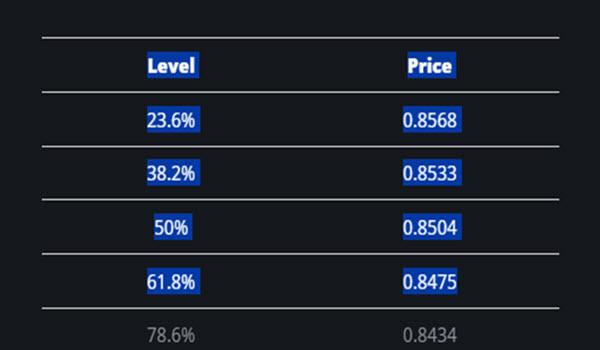
GBPUSD bounce from the 100 (blue) and 200 (yellow) moving average band would need to regain 1.28+ to expose resistance (1.2800-20) and retracement levels as shown below.
On the downside. 1.27 is a pivotal level that needs to trade above to keep a new found bid. Below it is key support is at the 1.2664 low and the major 1.2612 support.
There is a full UK economic calendar this week so the reaction will dictate whether GBPUSD has found a bottom.
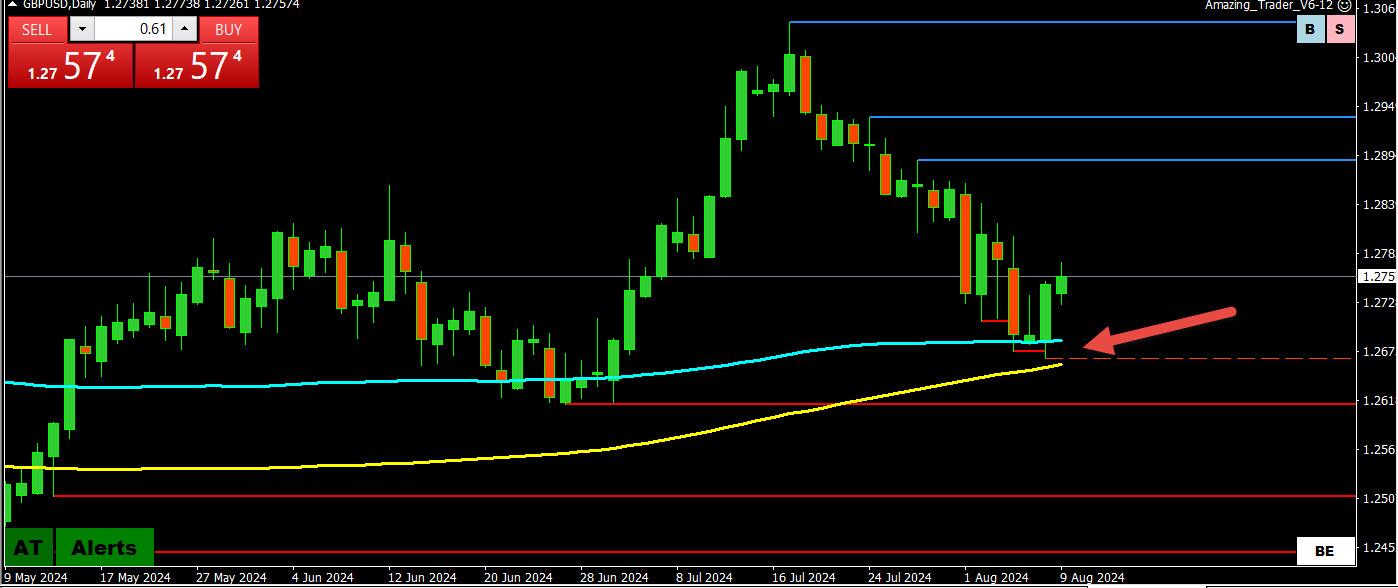
After breaking below the Channel Trend line, the same one is now acting as a Resistance -1.28050
It doesn’t mean that we’ll be watching Bears dancing, as it might be just a correction, but if that resistance shows strength, we should be falling one more leg…all the way to the Major Support at 1.24150.
That development can take about 4 days to happen….so it can be traded both ways ( as it is always the case with the Demon )
Try not to overcomplicate things and as you caught the exact Channel there, stay with it.
One technical explanation : It is a channel , not a Rectangle – Rectangle is Horizontal – here you have a nice angle – so Trend Channel
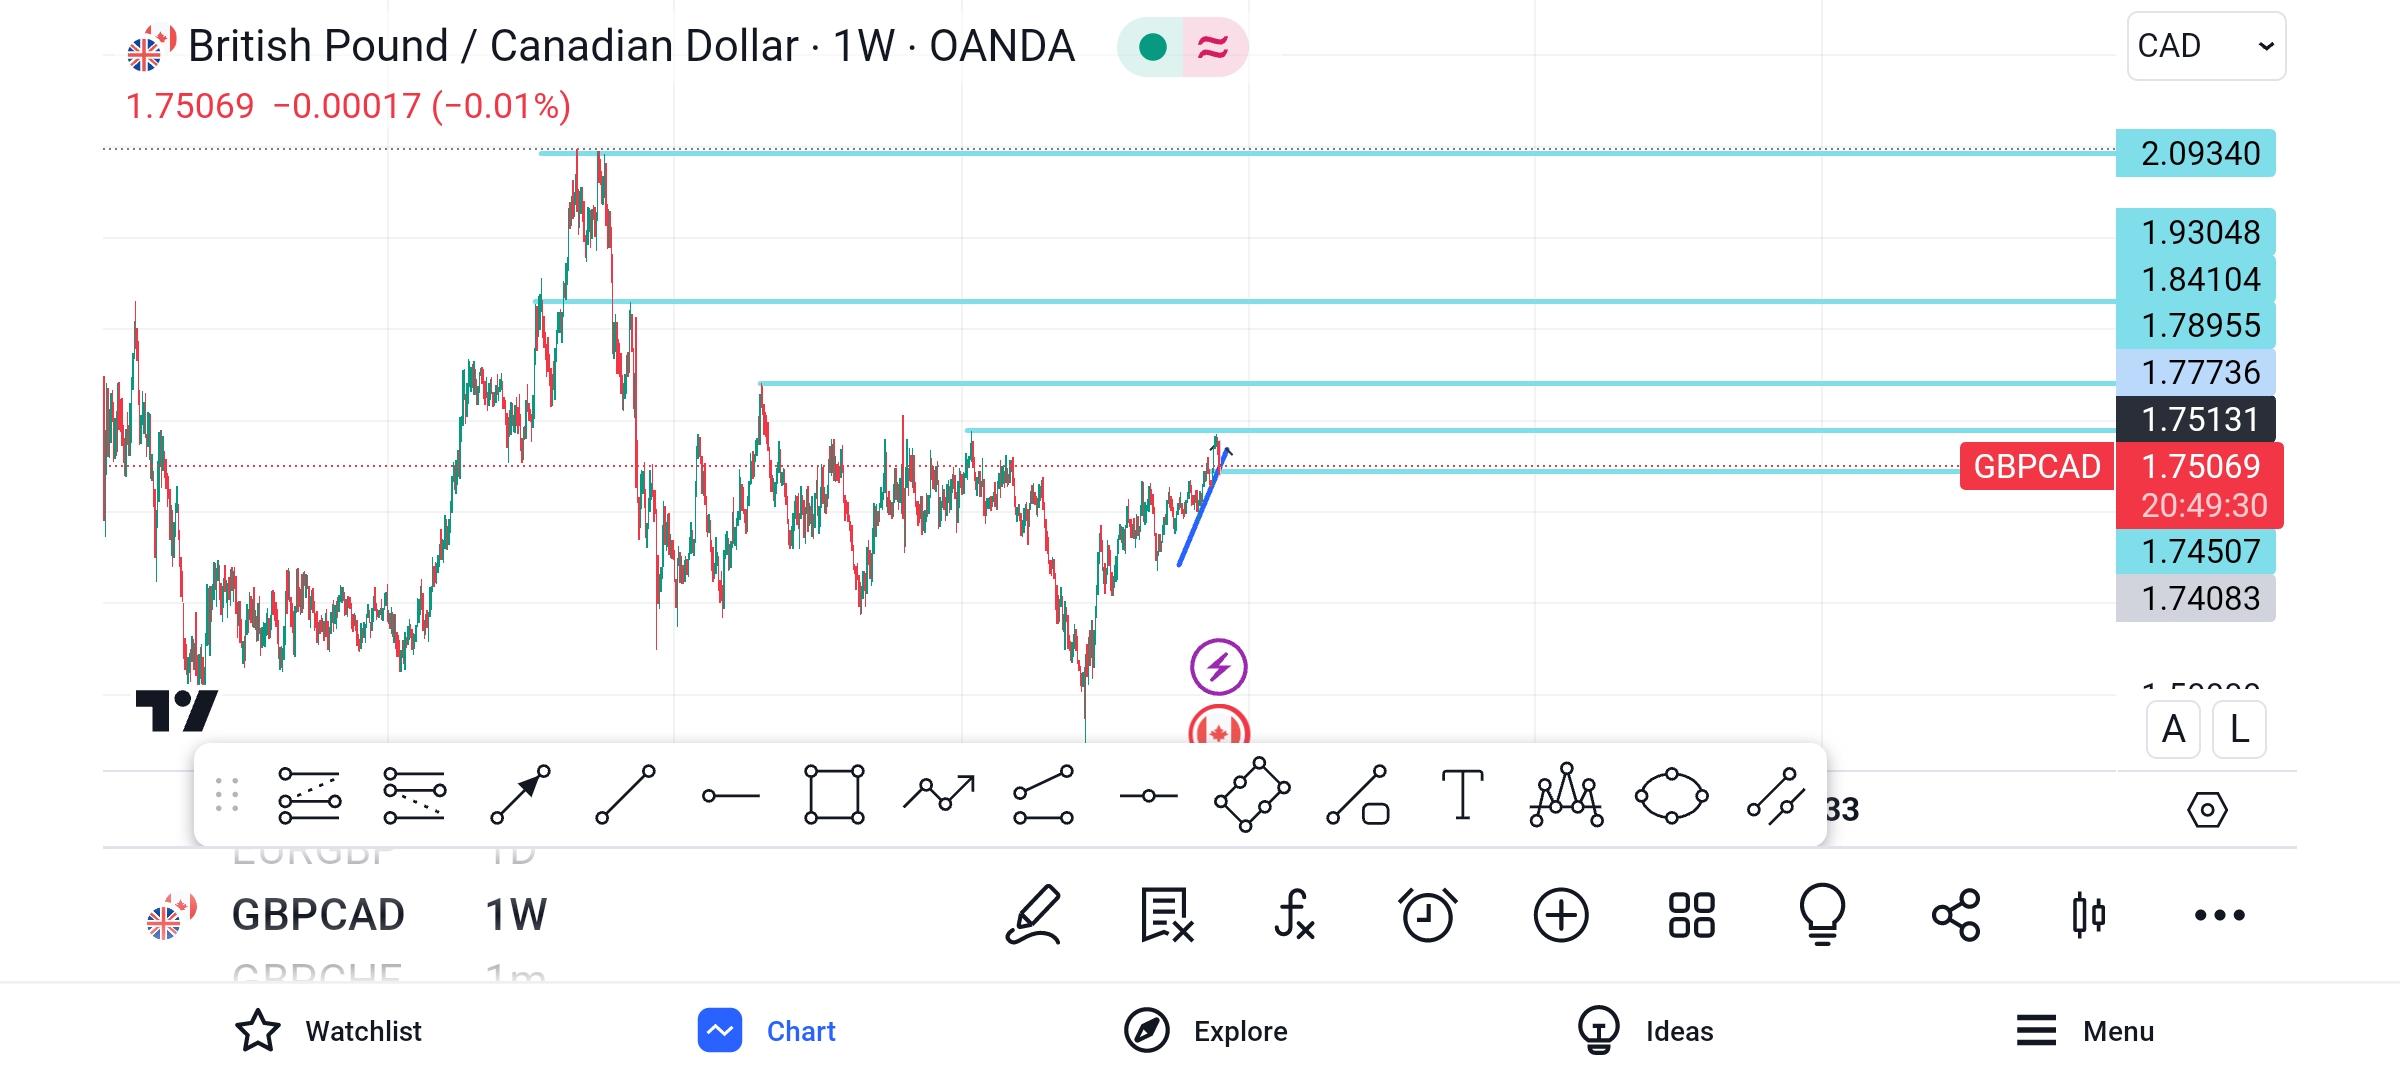
Your GBPCAD chart is more of Jay’s style, and you did it good – just try not to go predicting next move…it never works as planned…always look for a Wave in creation and Patterns ( we’ll go over that a bit later – first get good in this…and you are getting good J
As for your question : Orderblocks and Fear something…no offence mate, but that is a pure BS believe me – each time you hit something like that, ask about it as you just did , and we will give you a straight answer – like it or not J
If I told you that there was a large order in the market to sell EUR and buy GBP would you be looking to buy EURUSD or sell GBPUSD, do the opposite or step aside as the order gets executed?
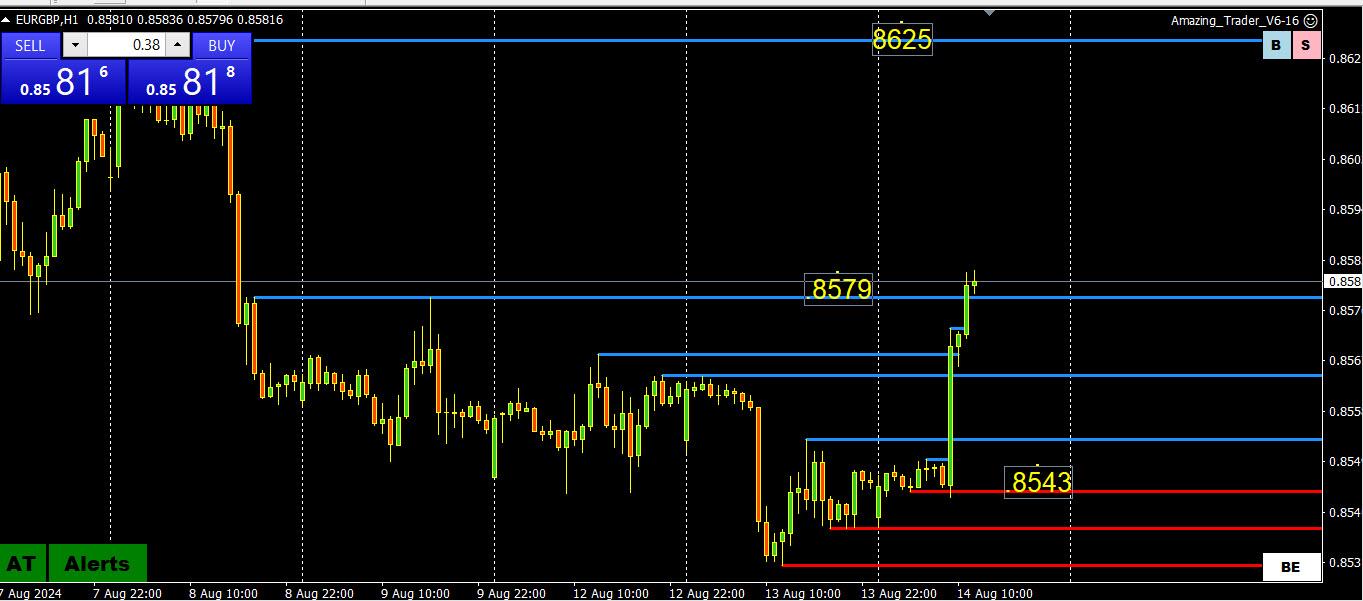
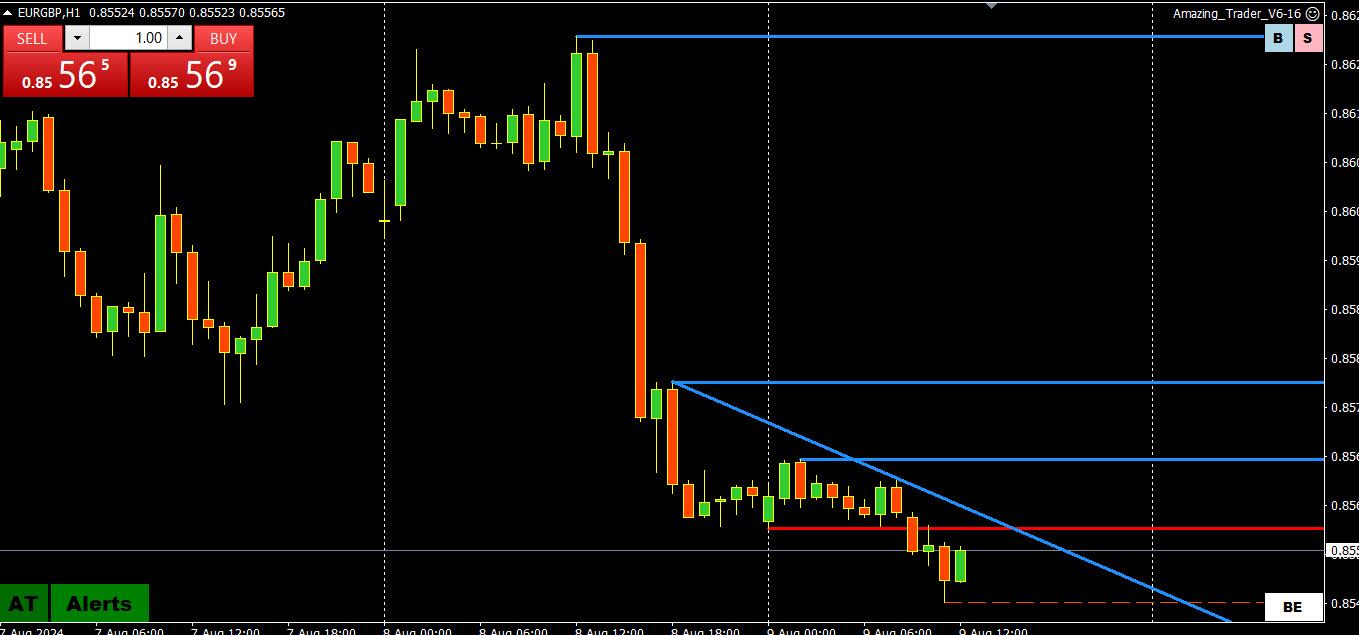
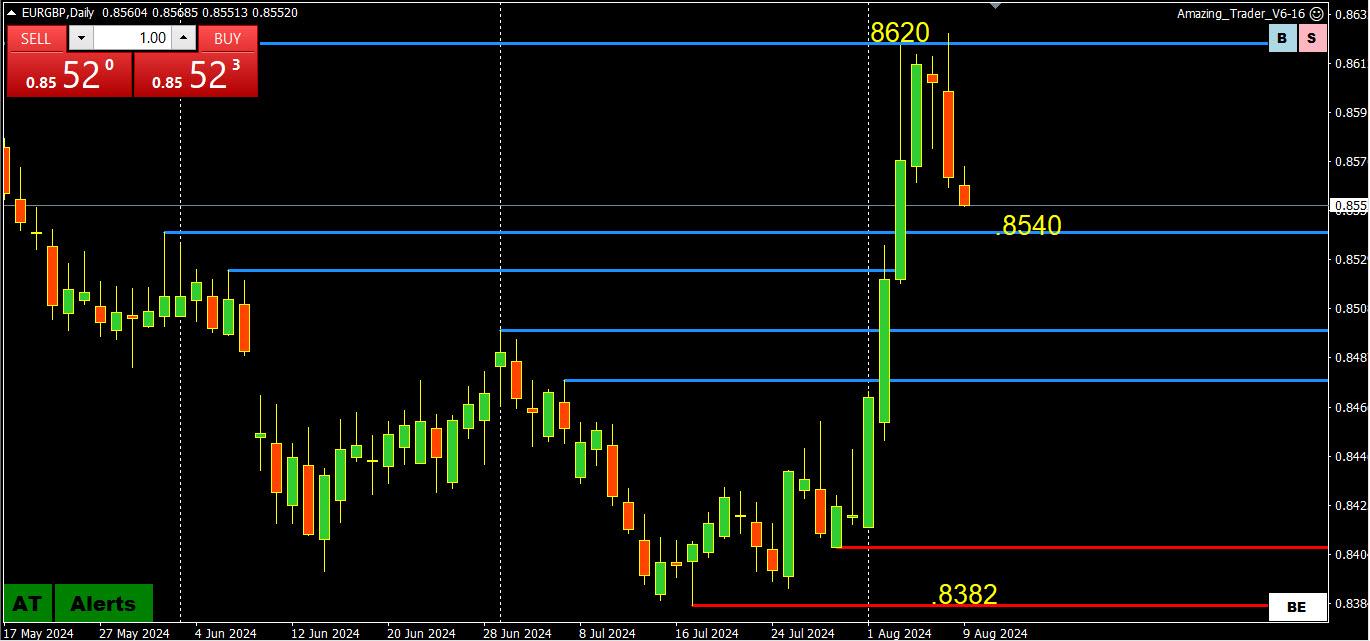
EURGBP DAILY CHART – Retracing after a failed break
This cross was a driver in yesterday’s turnaround day and again early today, boosting GBPUSD while EURUSD lags.
For those trading EURUSD, yesterday’s run through stops at 1.0892 was driven by selling of this cross that saw GBPUSD buying take over after EUREUSD selling did not follow through. (I will post a link to an article on using crosses to trade SpotFX).
Looking at this chart, it has been straight up from a low at .8382 to yesterday’s failed break of .8620 to a high at .8626, leaving no obvious support levels below the market.
Once again, thanks to JP for alerting us to the 100 and 200 daily moving average zone yesterday, where GBPUSD found support, helped by the reversal in EURGBP.
The move up is so far just a retracement that would first need to break the trendline and then move through 1.2800-20 to suggest a reversal.
On the downside, look for support if it holds above 1.2735.
Otherwise, look for 1.2750 to set the intra-day tone of trading within 1.27-1.28