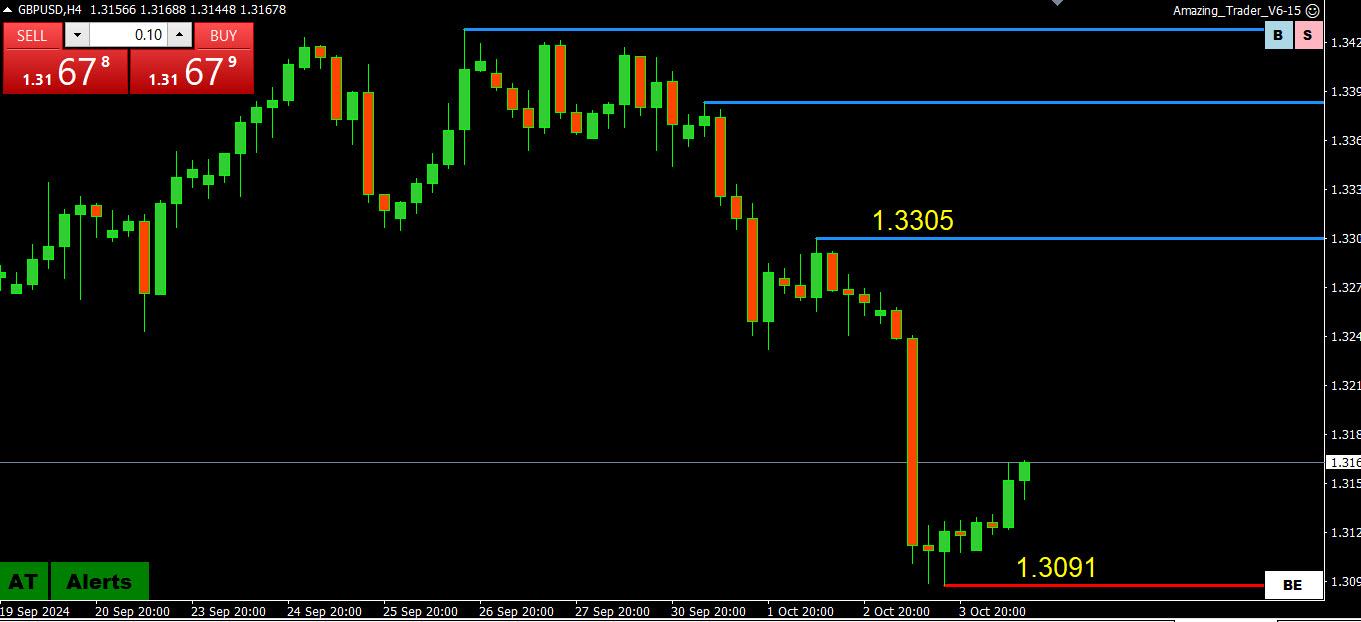
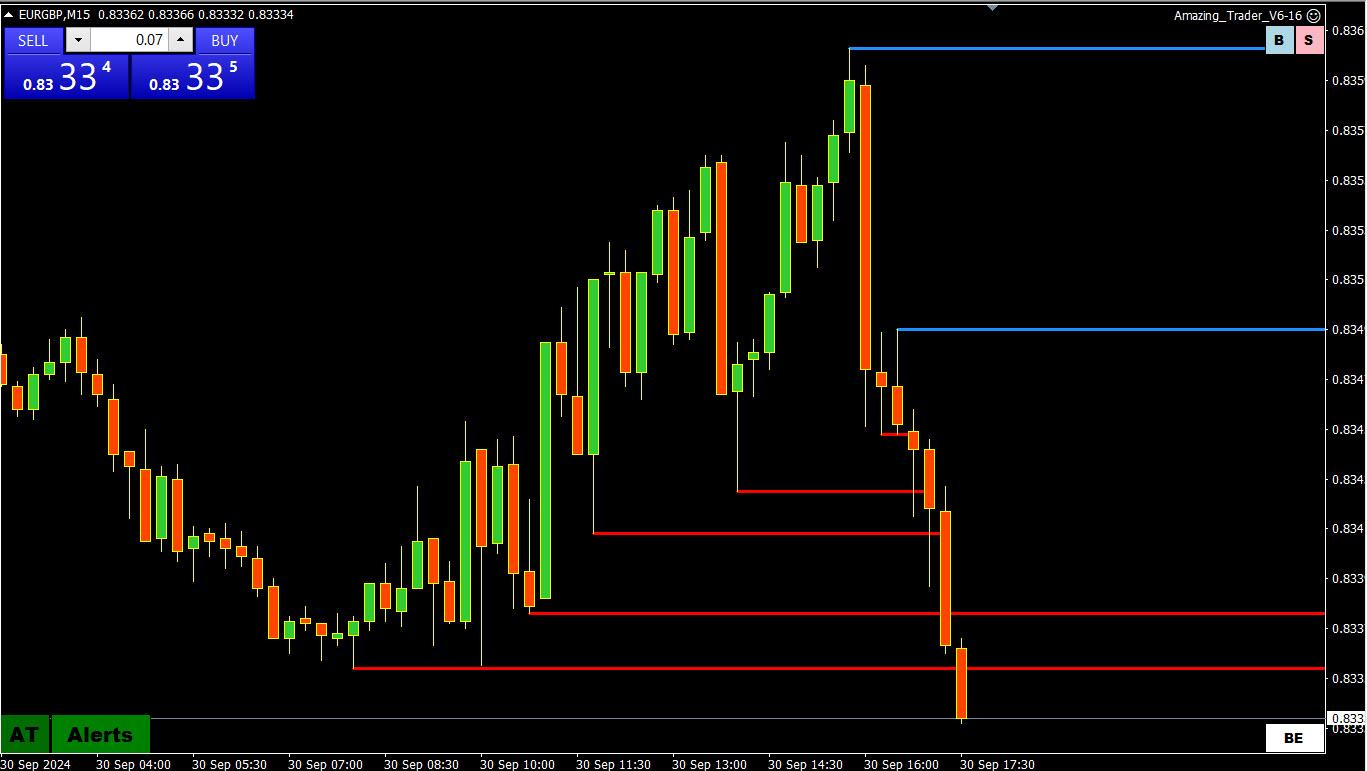
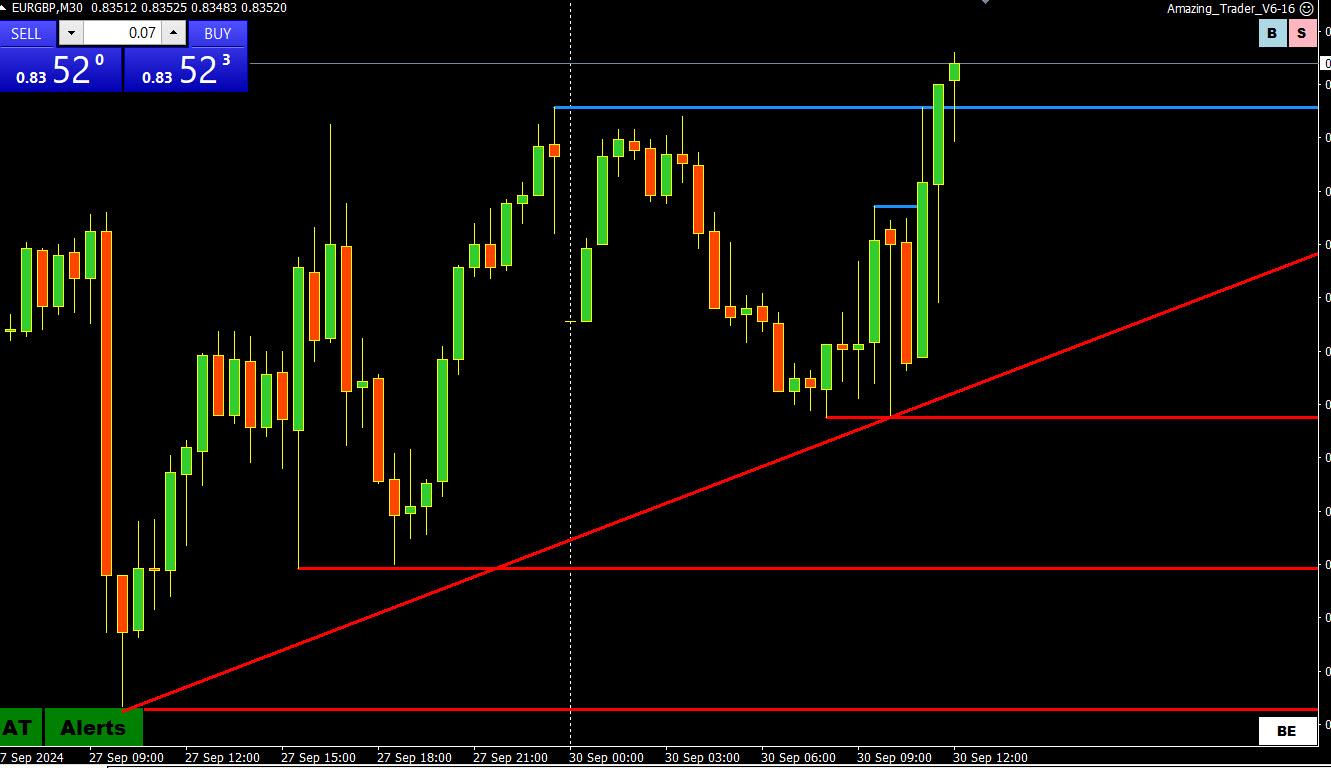
The AT Alert in EURGBP (short) is still active and well in the black but needs another 10 pips on the downside to hit its target. In any case. it caught the shift in directional risk… scroll down to see video posted below
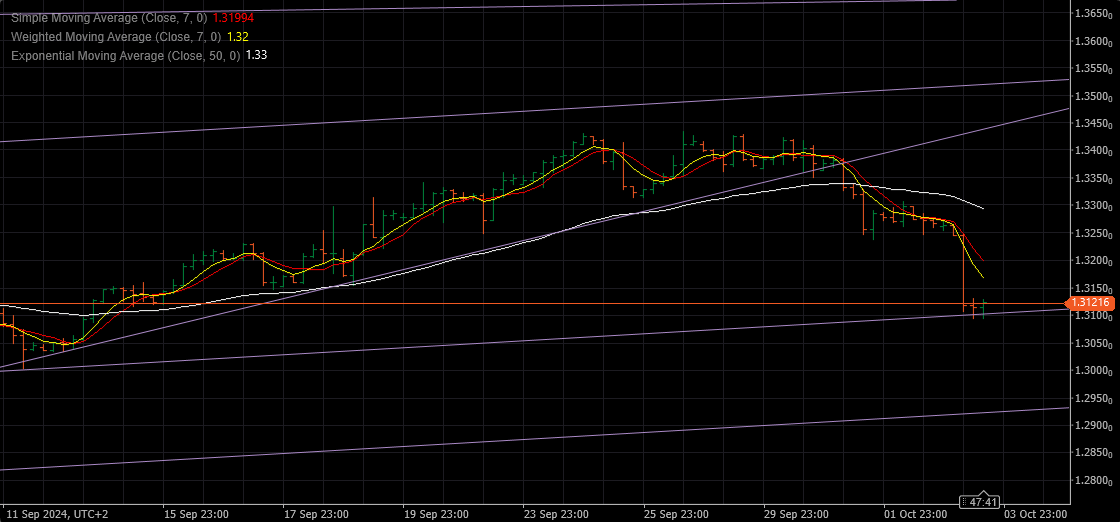
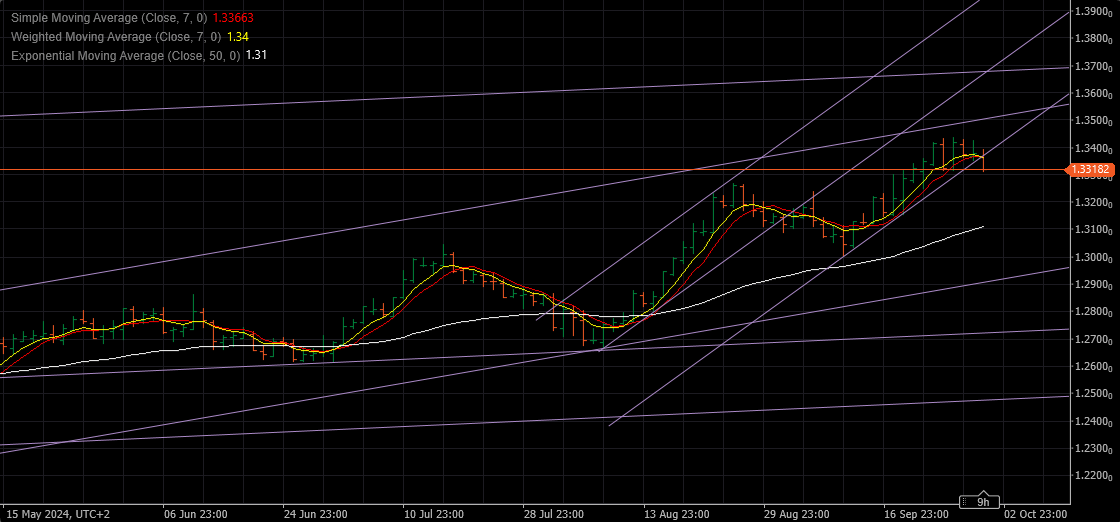
Neural conditions in GbpUsd are decidedly weighted toward the sell side right now. If the pair is trying to find value higher than current market I think it should run into a bit of trouble. 3250 is a bit of a price magnet.
If you are looking for the flow behind the GBPUSD bounce, look at EURGBP (lower).
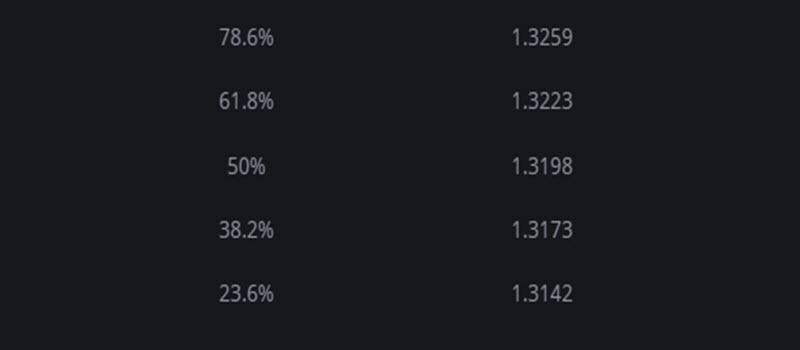
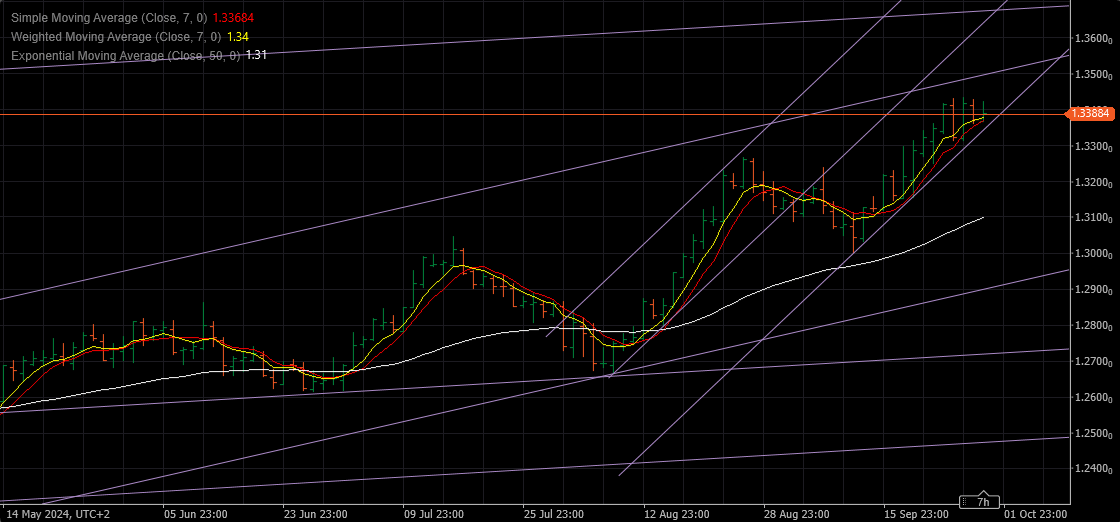
Given the sharp move down yesterday, see below for retracement levels using our Fibonacci Calculator as potential resistance levels. In any case, 1.32 is pivotal (5-% at 1.3198) on the upside. Otherwise, roll the dice, NFP is up next..
Among the holidays today which include National No Sugar Day, National Poetry Day, Bring Your Bible To School Day, and National Wide Awake Day, it is officially National Buy British Day. That certainly must support my earlier observation about some metrics and neural conditions being strong on the buy side of GbpUsd.
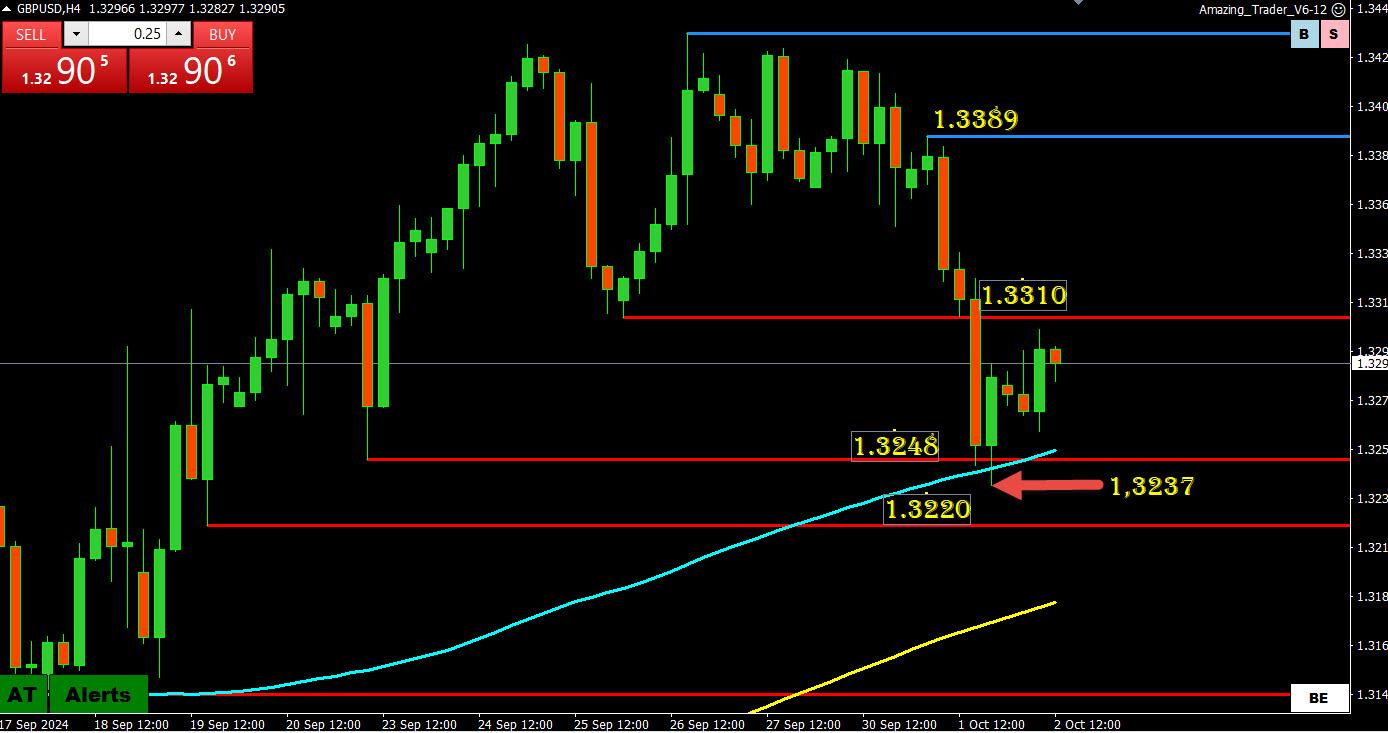
Some neural conditions show strength on the buy side in GbpUsd headed into the data. Not to say it won’t see selling along the way post-data but that is the condition.
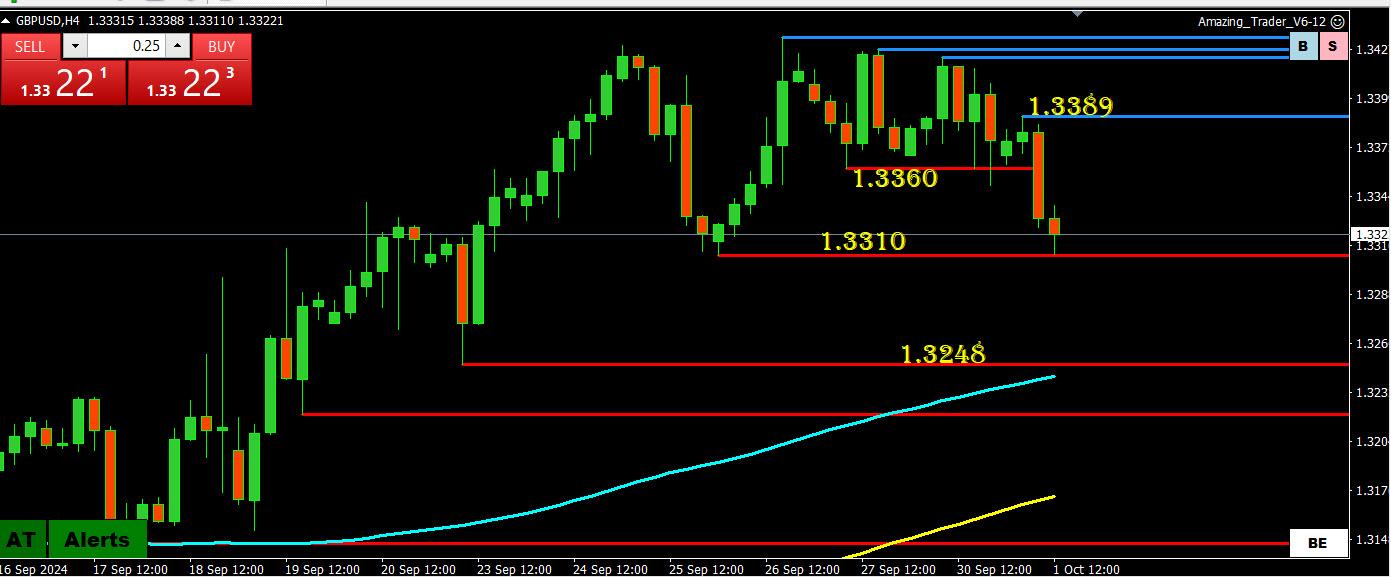
On the downside, 1.3310 is the make or break level, keeping the risk on the high while above it.
Logic says for GBPUSD to make a serious break to a new high, EURUSD would need to establish above 1.12 and/or EURGBP would need to make another leg down.
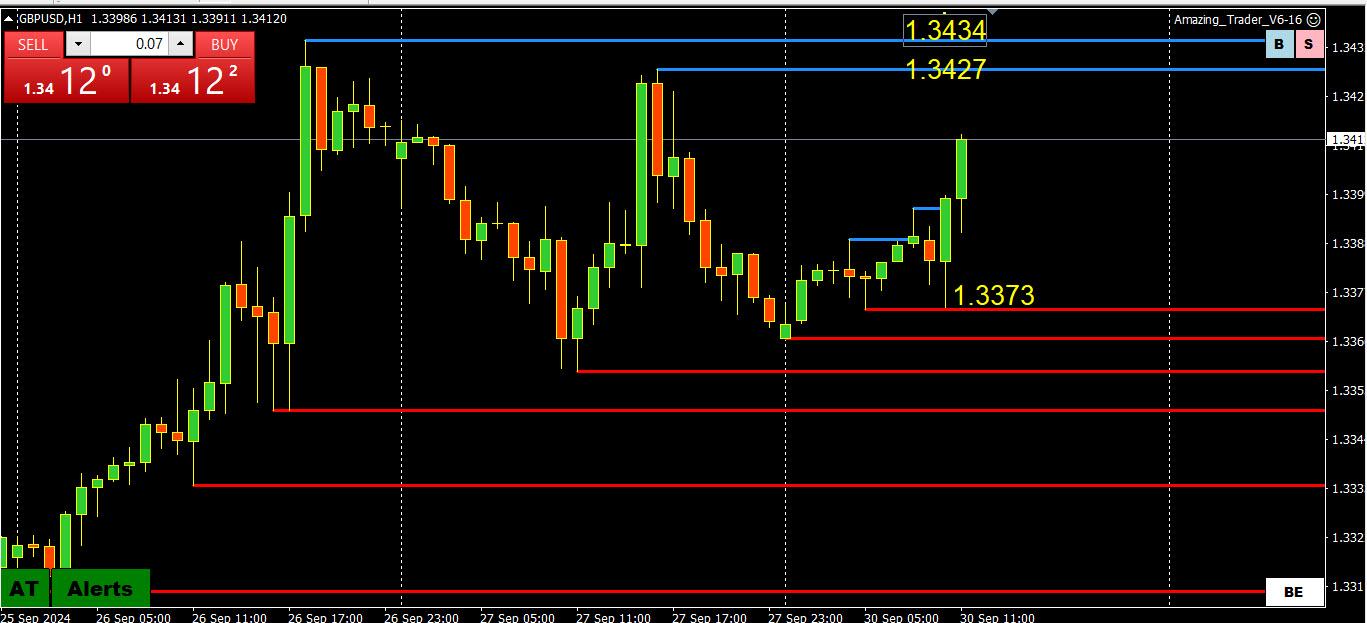
Cable is struggling for 5 days already with the top and using some Thumb analysis we can expect start of a correction, unless it takes out today 1.34350.
However, Close tonight above 1.33850 would leave an opportunity for one more leg Up and test of 1.34950.
One observation I have made for month end is that EURGBP flows can be quite active and often fickle, influencing GBPUD, EURUSD or both (currently giving EURUSD some support).
GBPUSD remains an outperformer, trading at a level not seen since early 2022.
With the next key level not until above 1.37, use the most recent high (1.3434) as key resistance.
On the downside, 1.3310 is the make or break level, keeping the risk on the high while above it.
Logic says for GBPUSD to make a serious break to a new high, EURUSD would need to establish above 1.12 and/or EURGBP would need to make another leg down.
1. Why would you pay attention to a “bias indicator” based on the total of retail customers of a brokers client base knowing the vast majority of retail traders are wrong and lose their money? Nice gimmick.
2. A well known and highly frequented FX “advisor” frequently quoted in news feeds, primarily to retail audience noted very early this morning before the action really hit that “UsdChf is trading flat, best to stay away.” Why? Would it not be better to learn how and why to be active in it successfully? The pair dropped over 100 points in a short period of time. They don’t know what they are doing beyond average in my opinion. They do have solid informational value if you are novice.
3. Why would you not listen to a highly skilled and very kind former bank Trader like Jay Meisler instead? Or a former in demand CTA such as myself or the other actual and very skilled former bank traders who frequently post here in GVI?
I sold UsdJpy right before it collapsed last night in late Asia. I have been long AudUsd since yesterday. I have been short UsdChf since yesterday against a lot of opinions to be long US Dollar. I have been long GbpUsd since yesterday. Picking away at EurJpy on both sides the entire way. You won’t find that with Youtube or TikTok gurus or the aforementioned not as stellar as advertised advisory sources which are popular.
You will find it here in GVI.
Disclaimer – I am not paid by GVI or under contract with GVI in any fashion. I am simply commenting in the hope of being helpful and enjoy the input from others here.