interest policy at fault and to blame ?
–
* For the whole of 2023, Japan’s nominal GDP grew 5.7% over 2023 to come in at 591.48 trillion yen, or $4.2 trillion based on the average exchange rate in 2023.
* Germany on the other hand, saw its nominal GDP grow 6.3% to reach 4.12 trillion euros, or $4.46 trillion based on last year’s average exchange rate.
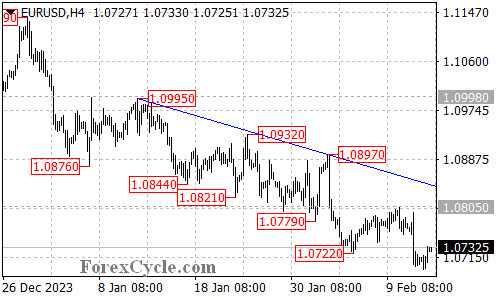
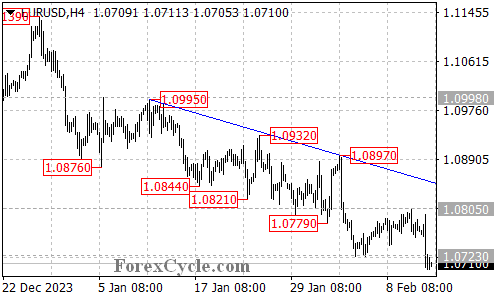
EURUSD Analysis: Downtrend Continues, Resistance and Downside Targets
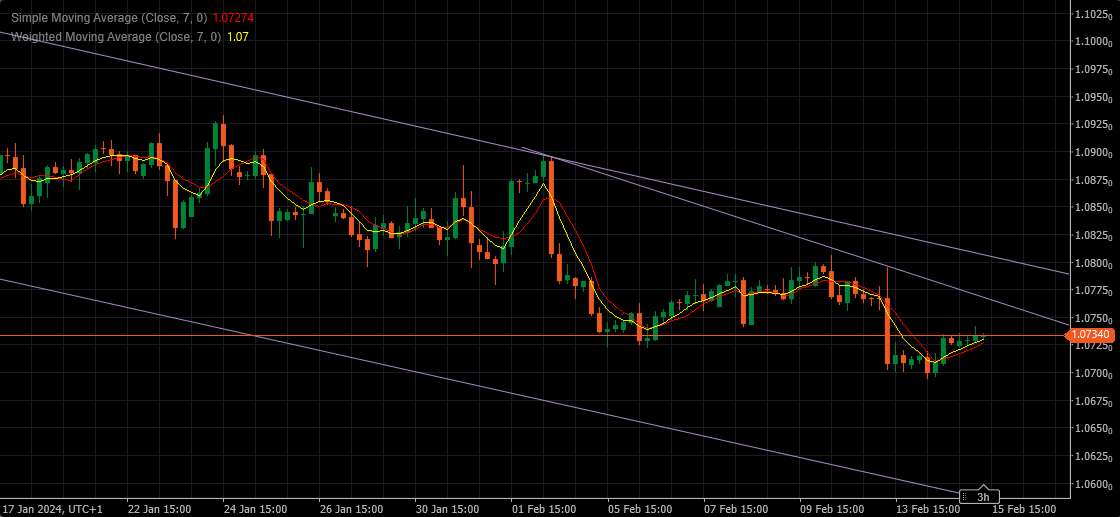
The EURUSD pair remains below a falling trend line on the 4-hour chart, indicating the continuation of the downtrend from 1.1139.
As long as the price remains below the falling trend line, it is likely that the downside move will persist. The next target area for the pair would be around 1.0670, followed by 1.0600.
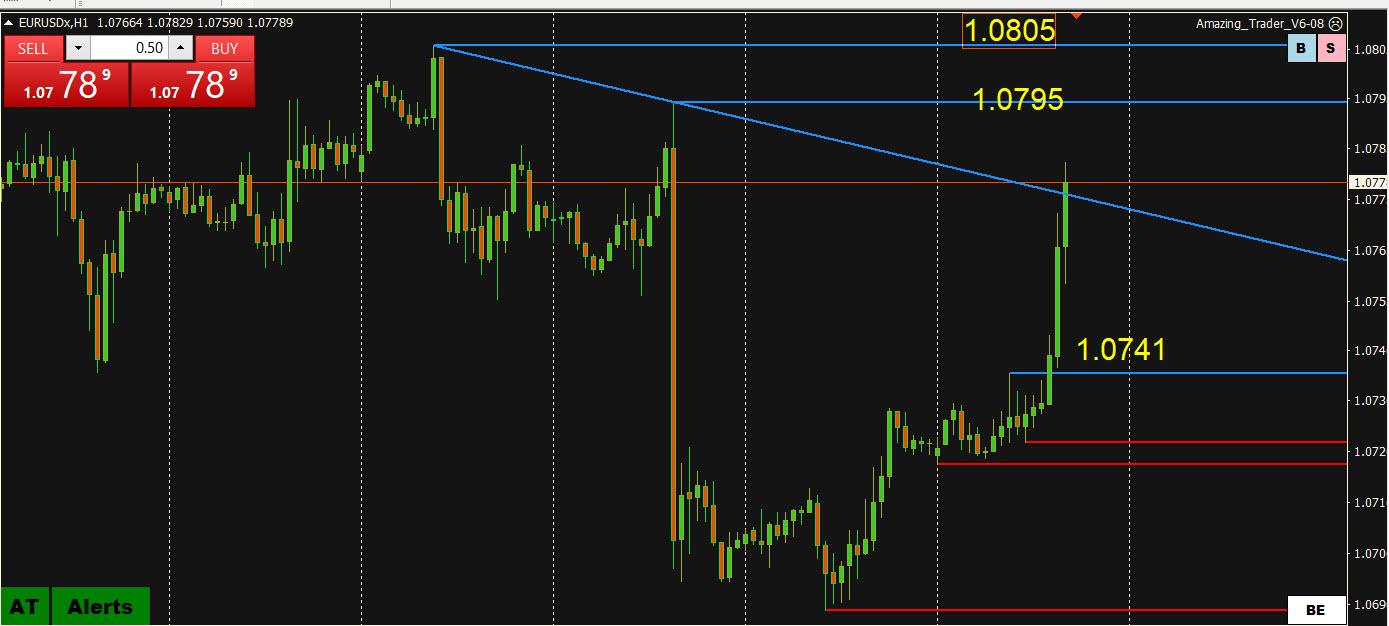
The initial resistance level is located at 1.0750. A breakthrough above this level would suggest a consolidation phase for the downtrend is underway. In such a scenario, the price could retest the 1.0805 resistance level. If this level is surpassed, it may trigger further upside movement towards the falling trend line.
It is important to note that only a break above the trend line resistance would indicate the completion of the downtrend.
In summary, the EURUSD pair remains in a downtrend, with the price staying below a falling trend line on the 4-hour chart. Downside targets have been identified, while resistance levels have also been highlighted for potential retracements. The completion of the downtrend would require a significant break above the trend line resistance.
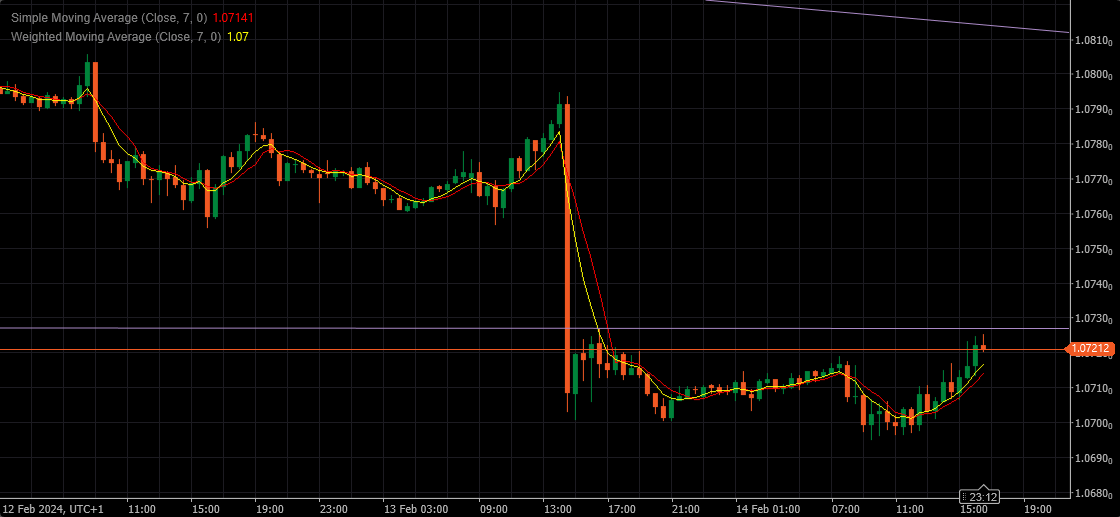
This is EURUSD 30 min chart – Pattern suggest that the next move is down. Without some outside push, we should be trying the low again in next few hours
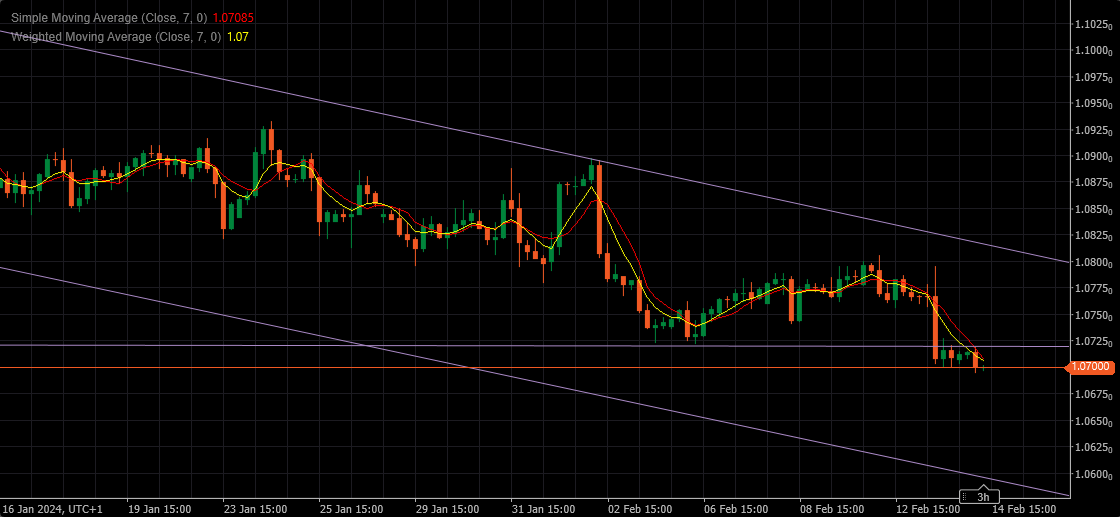
EURUSD Analysis: Break Below Support and Potential Further Decline
The EURUSD pair has broken below the 1.0723 support level and extended its downward movement from 1.1139, reaching as low as 1.0700.
Based on this development, it is likely that further decline could be expected in the coming days, with the next target area around 1.0670, followed by 1.0600.
The initial resistance level is located at 1.0750. A breakthrough above this level could lead to a retest of the 1.0805 resistance level. If this resistance is surpassed, it may trigger additional upside movement towards the falling trend line on the 4-hour chart.
In summary, the EURUSD pair has broken below key support levels, indicating a potential continuation of the downward trend. The next targets for decline have been identified, while resistance levels have also been highlighted for potential retracements.
Belgrade Knez
PARTICIPANT
Like
(89.23.77.32)
10:43 am
EURUSD had four bullish days and yesterday was bearish one …. hopefully today CPI can break and send it below 1.0722
 As long as the price remains below the falling trend line, it is likely that the downside move will persist. The next target area for the pair would be around 1.0670, followed by 1.0600.
 1.0694