Coming back to JPs question of the page resets while typing out a post -> Does this also apply to the charts page? It seems that I can set up a page with parameters set on a currency pair and it’s time frame, only to have it reset to eur/usd daily every time the page refreshes. Is it possible to avoid this? If so, how?
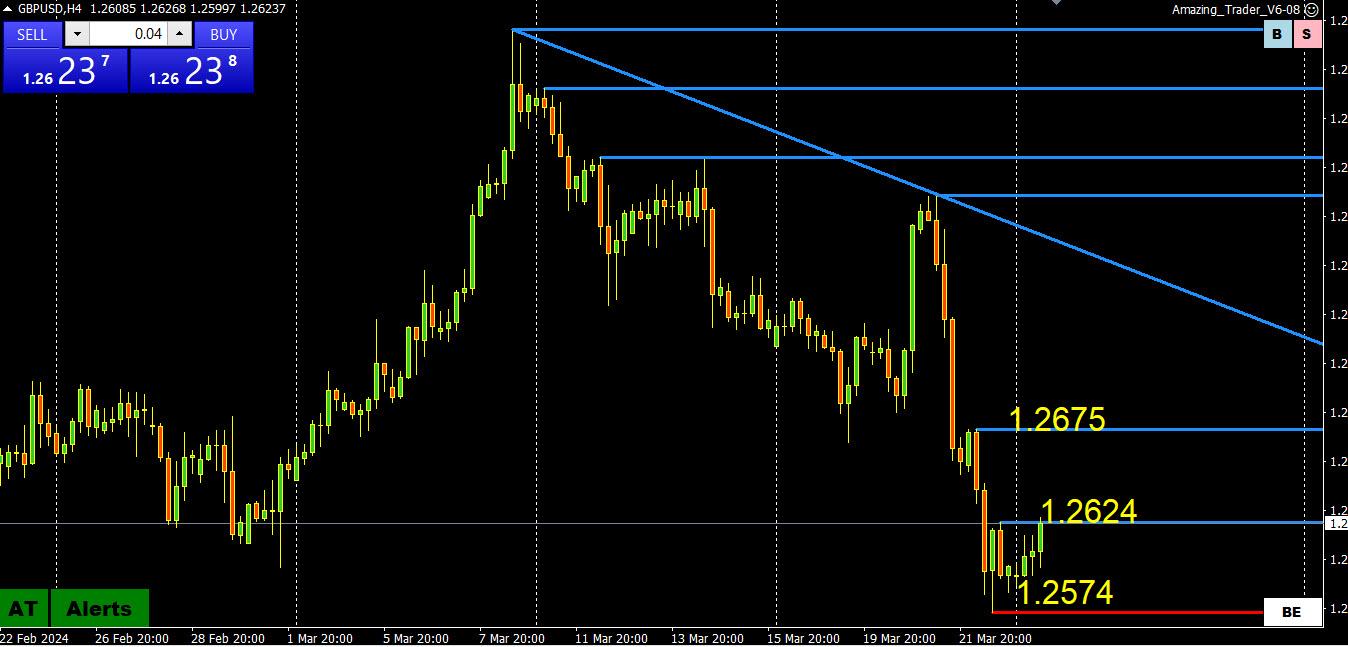
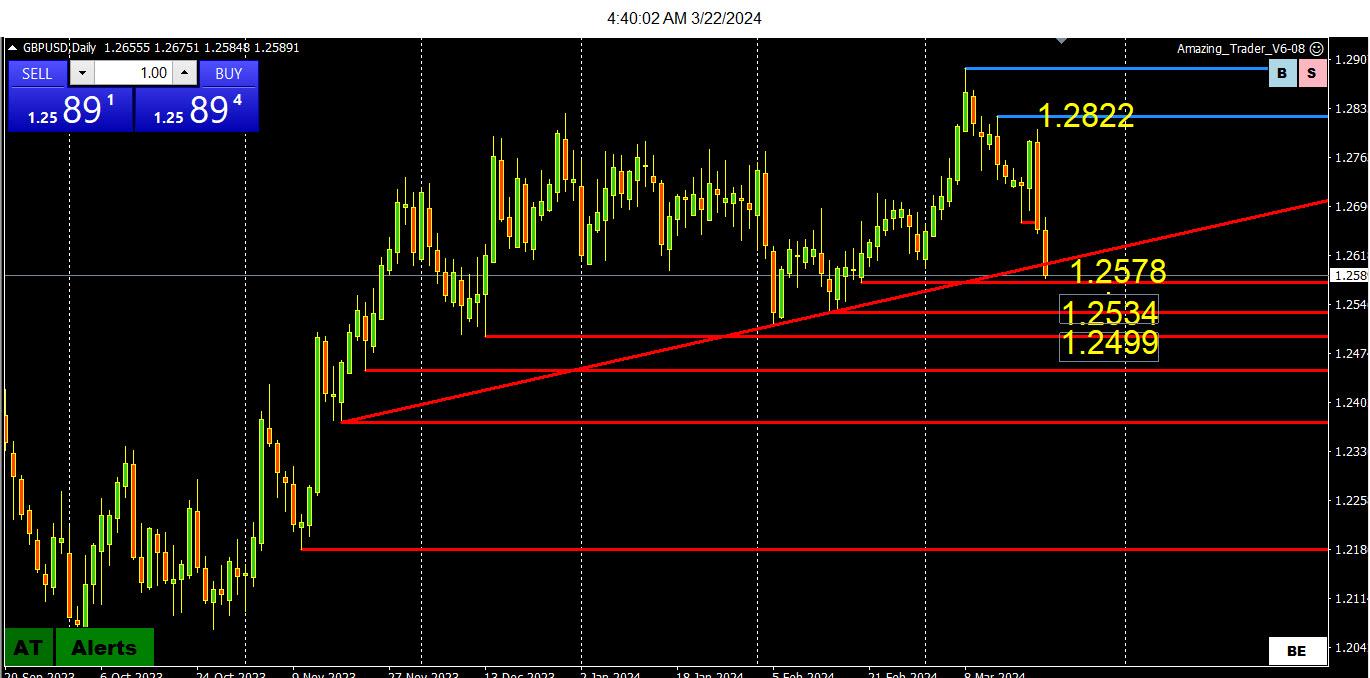
GBPUSD bounce off its 1.2574 low is so far just a retracement. To suggest a low is in, 1.2675 would need to be taken out, Currently, resistance at 1.2524 is being tested but this is only a minor level.
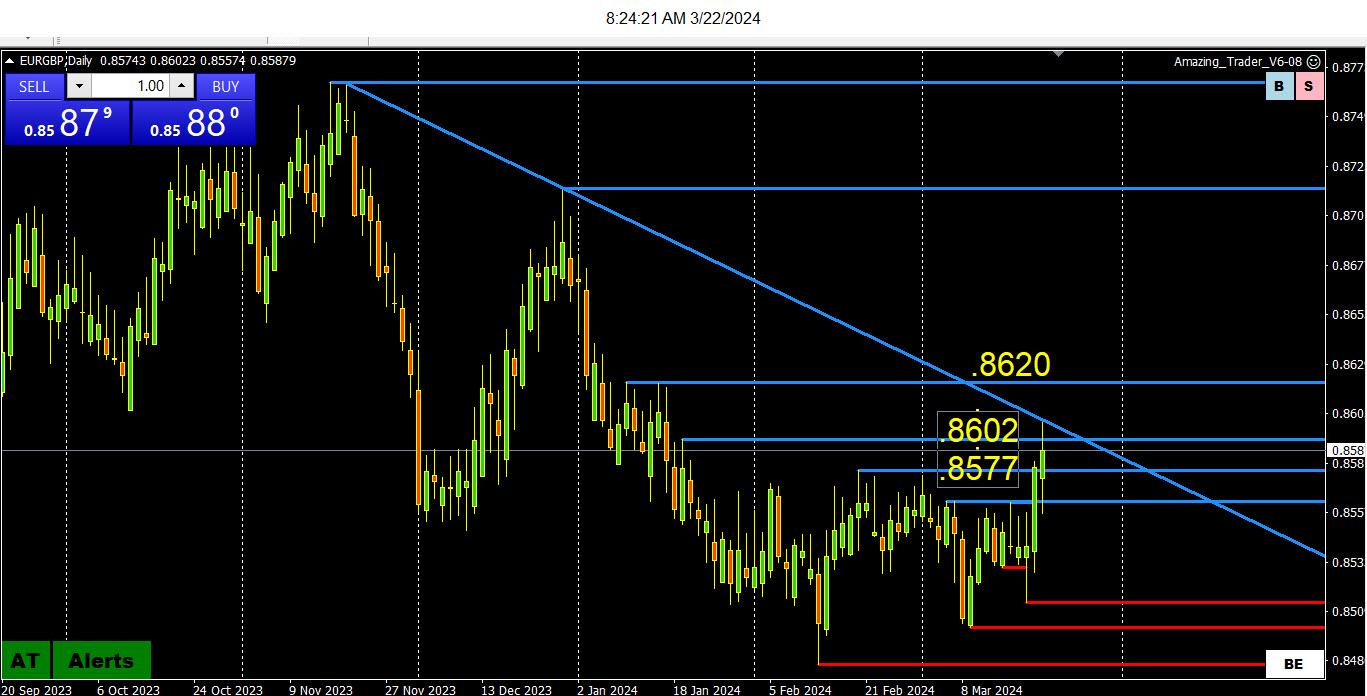
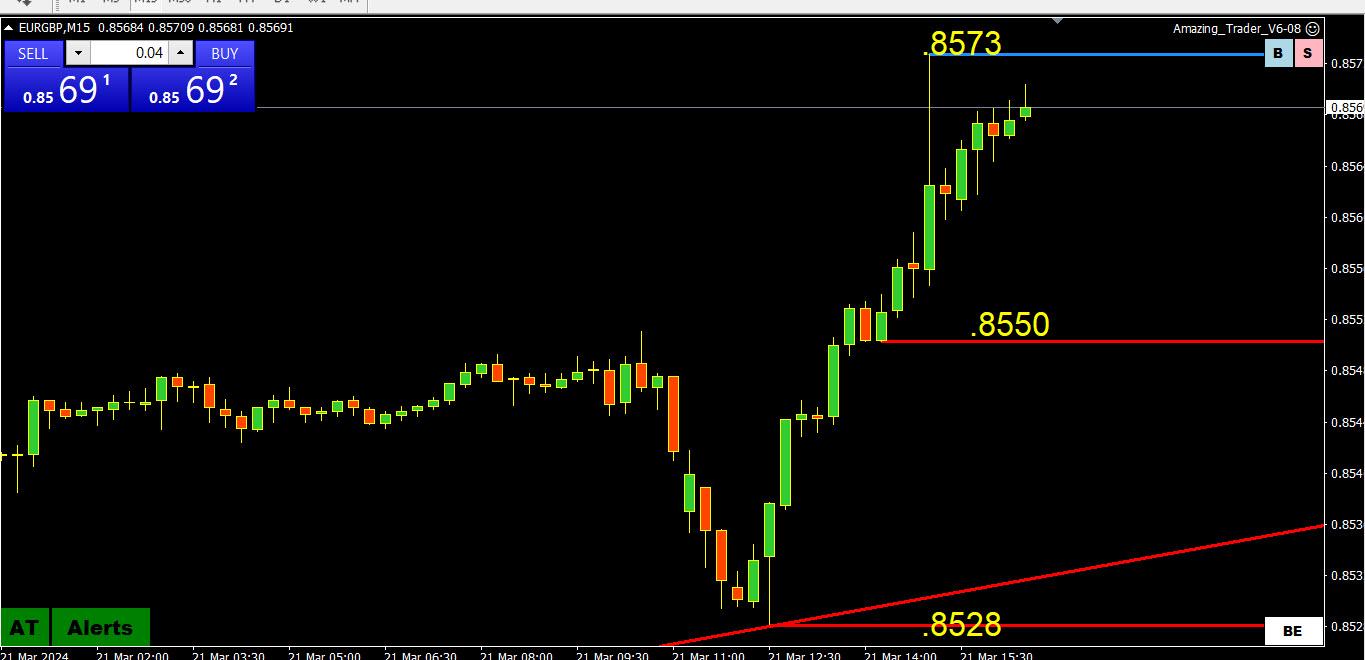
Note, EURGBP has backed off from .8600 and this has eased some of the selling pressure on GBPUSD.
THIS WEEK’S MARKET-MOVING EVENTS (all days local) realization
Rectify
Preliminary March reports on French and Italian consumer prices will be posted on Friday and will set up expectations for the Eurozone’s harmonised report on Wednesday, April 3; expectations are flat to lower for France and higher but still very low for Italy. Tokyo consumer prices for March will also be posted on Friday and will set up forecasts for the month’s national consumer prices to be posted in mid-April; slowing rates of inflation are expected.
PCE price indexes, part of Friday’s personal income and outlays report, will wind up US inflation data for the month of February and are not expected to show much if any improvement. Australia will post its CPI report for the month of February on Wednesday.
Canadian GDP for the month of January will be a highlight of Thursday’s session and is expected at plus 0.4 percent. Both Japanese retail sales and industrial production will be posted on Friday with a soft report expected for the latter. And posted on Sunday, March 31 Chinese time will be the country’s official CFLP PMI report which is expected to show improvement for manufacturing.
JP – I’m thinking 105 due to slight deterioration of risk appetite across markets. Commodities, stocks, Euro, even Usd a pinch. Looks like if 104 survives Monday its 105ish.
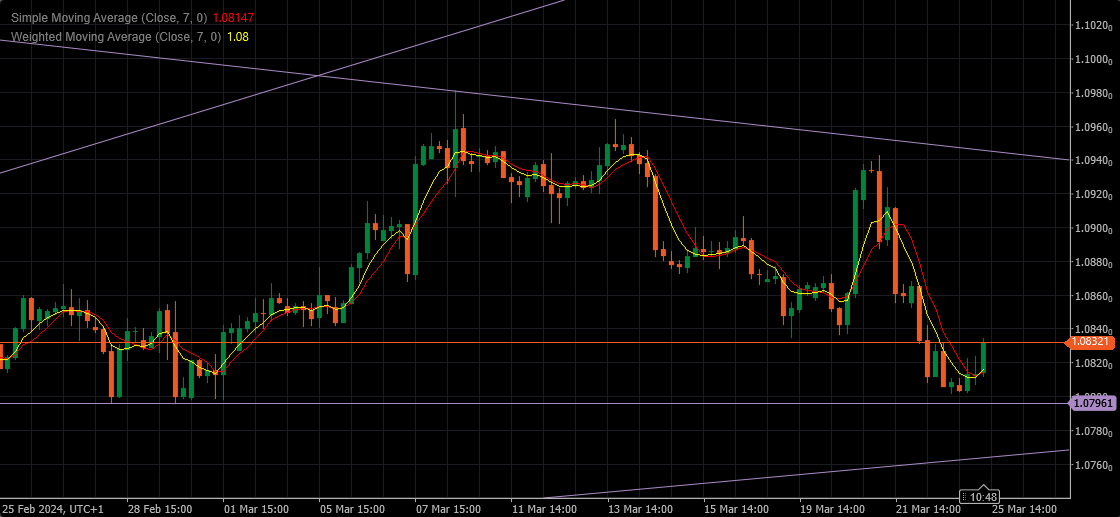
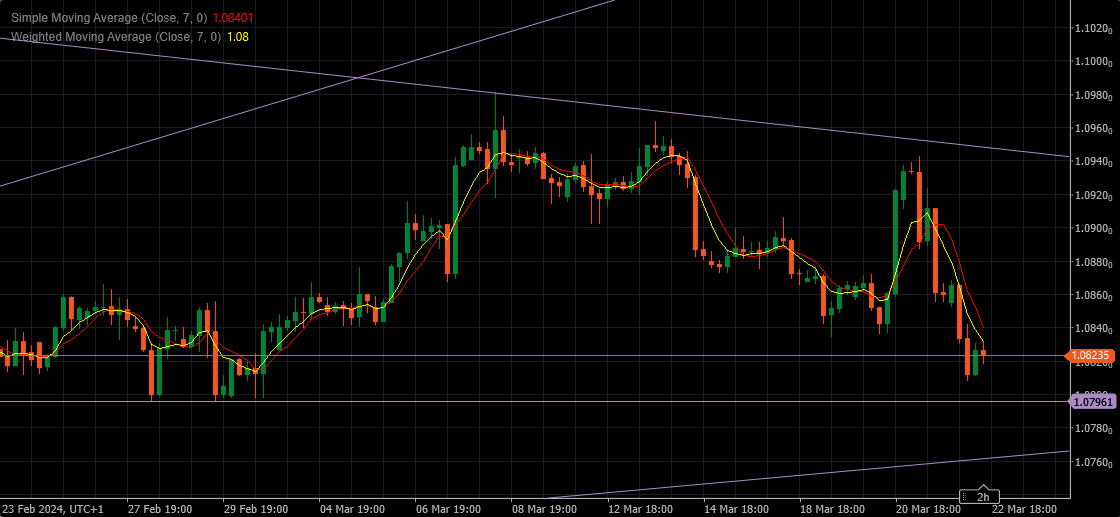
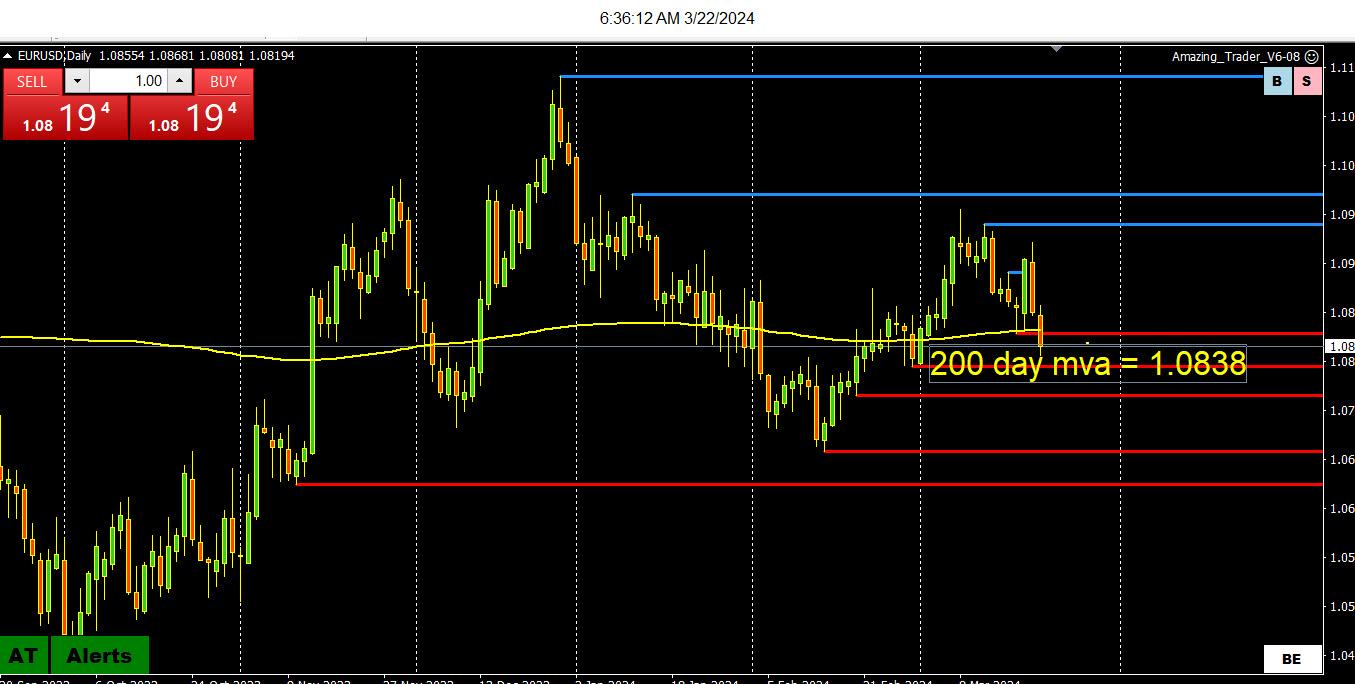
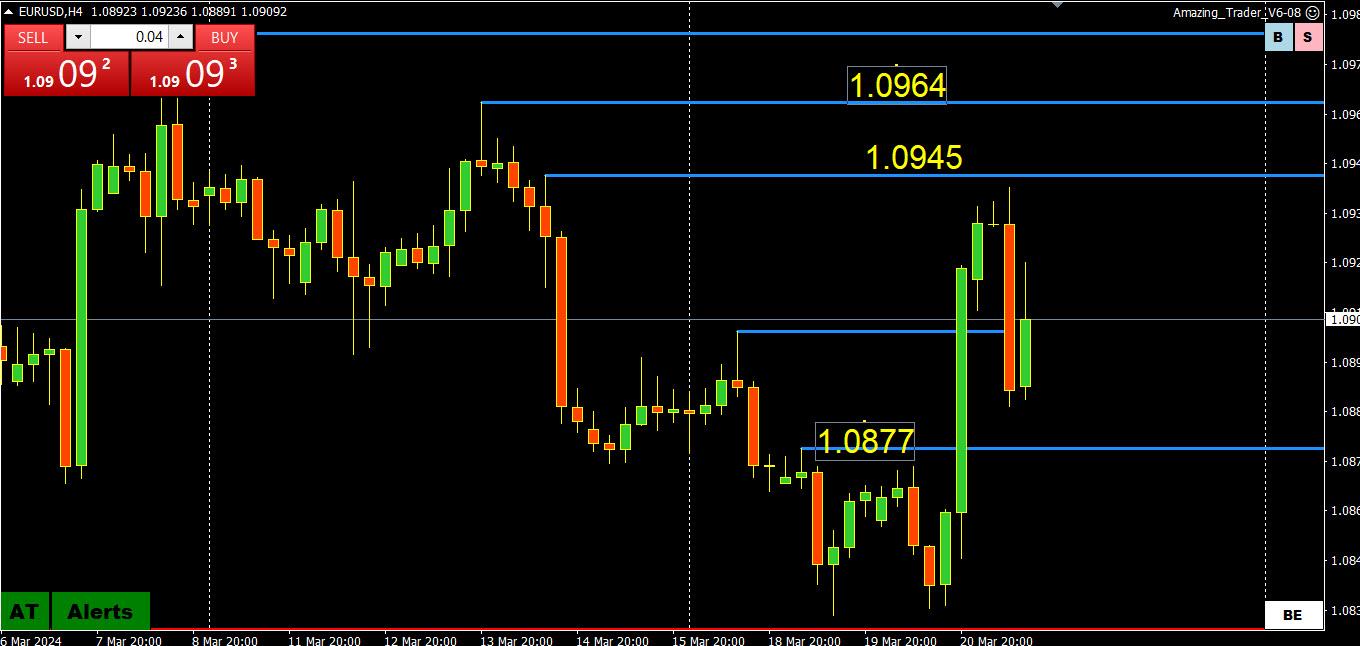
The failure to test 1.0945 has seen EURUSD retreat in line with a firmer USD.
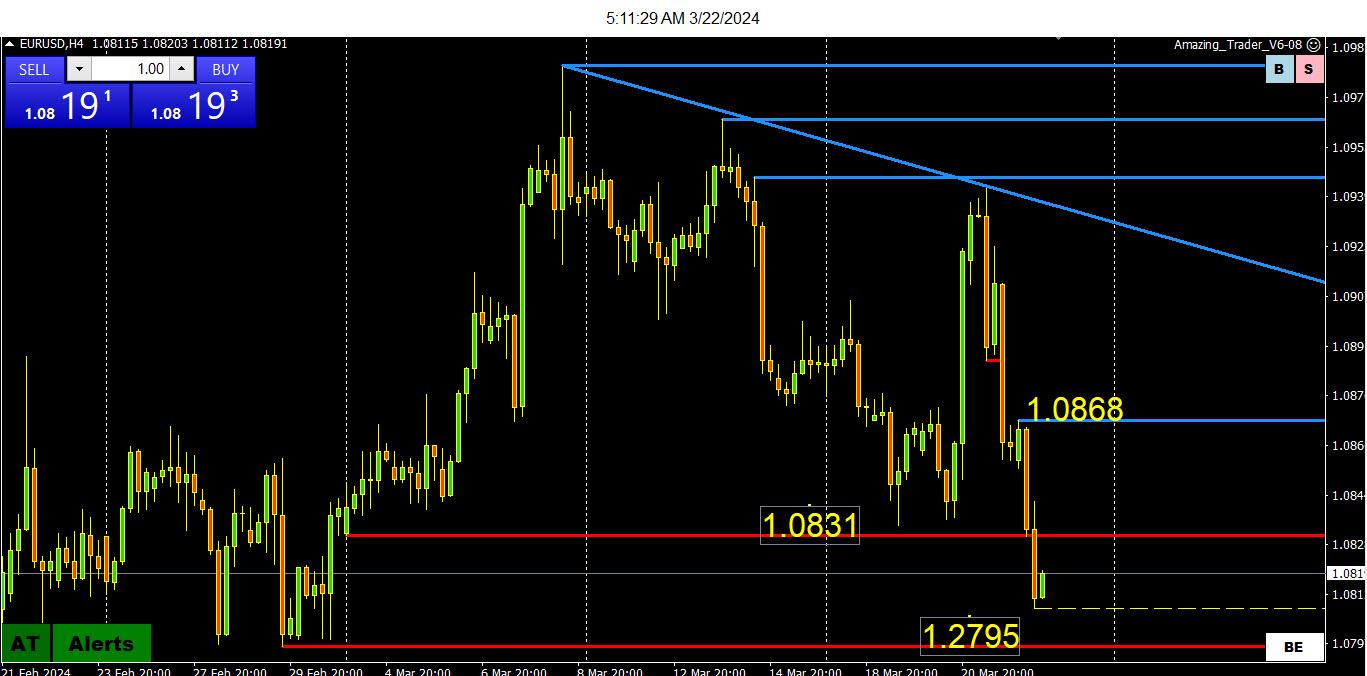
The key chart support, as I noted yesterday, is 1.0795 but the magic 1.08 level is probably equally important as it will dictate the tone going forward.
On the upside back above the broken 1.0831, at a minimum, would be needed to ease the risk to 1.08.
The old trading adage that it’s the reaction to news more than the news itself that matters held true in the GBPUSD as it took another leg down after dovish comments from BOE Bailey in an FT article. Price moves (note firmer EURGBP as well) underscore how interest rate cut expectations are driving these markets.
I had to go to the daily chart to find potential support levels on the downside, So far, an AT support at 1.2578 is holding, below it there is one level ahead of the pivotal 1.25.
Hard to chase after a big move but it trades soft below the lower end of intra-day resistance is at 1.2645-75,.
Take a look at the 2 blue AT lines on the daily chart, the failure to test the 2nd line, and how the risk turned to the downside.
EURO 1.0898
–
In my optique eurdlr has somewhere between neutral a bid undertone
demand for euro and dump of chf is helped put a floor under the euro sub 1.09
I think hitting 200dma now is a bridge too far and
prefer buying dips while price is above it.
Whipsaw in trading describes a sharp increase or decrease in an asset’s price, which goes against the prevailing trend. Whipsaw is different to other reversals because it is characterized by a sudden change in an asset’s momentum shortly after a trader has opened their position.
Today: EURGBP fell to its low after weak EZ flash PMIsand then turned bid after the BOE monetary policy decision
This is a whipsaw
Meanwhile, the chart does not show the key level on top, which is at .8576 (high so far .8573)
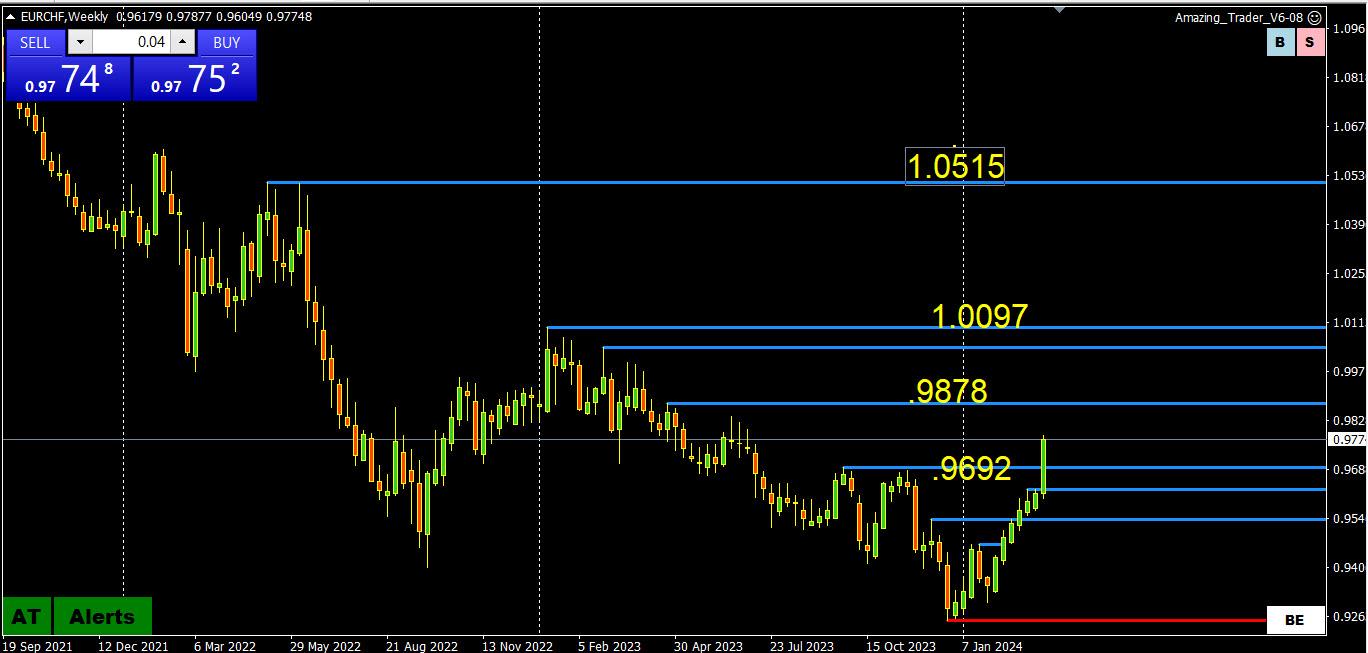
I like to look at longer time frames even though I rarely trade using them. What it does is put the current price moves in perspective and help me determine which side to trade from.
What still amazes me looking at this chart is how Amazing Trader algo levels, which I would not have put on a chart drawn manually, often hold, such as the 1.0945 level in this chart (and I created the program).
Looking at the chart, 1.09 will continue to be a focal point until it is established on either side.
In the meantime, expect some support as long as it can hold above the 1.0877 level broken yesterday but on the other side, upside is limited unless 1.0945 is broken (high today 1.0942).
Author
Search Results
Viewing 20 results - 2,661 through 2,680 (of 3,017 total)