
Another day, another indicator. This time, we want to look at how to use the MACD indicator to see what it is all about and how it might come in handy as you are trading. If you...
Cart
To use Cart please install WooCommerce plugin
Return to previous page
Page 9
How to Use Bollinger Bands Those who trade will need to use a variety of tools to get their trading off the ground and working for them. One of the tools to include in any toolbox is...
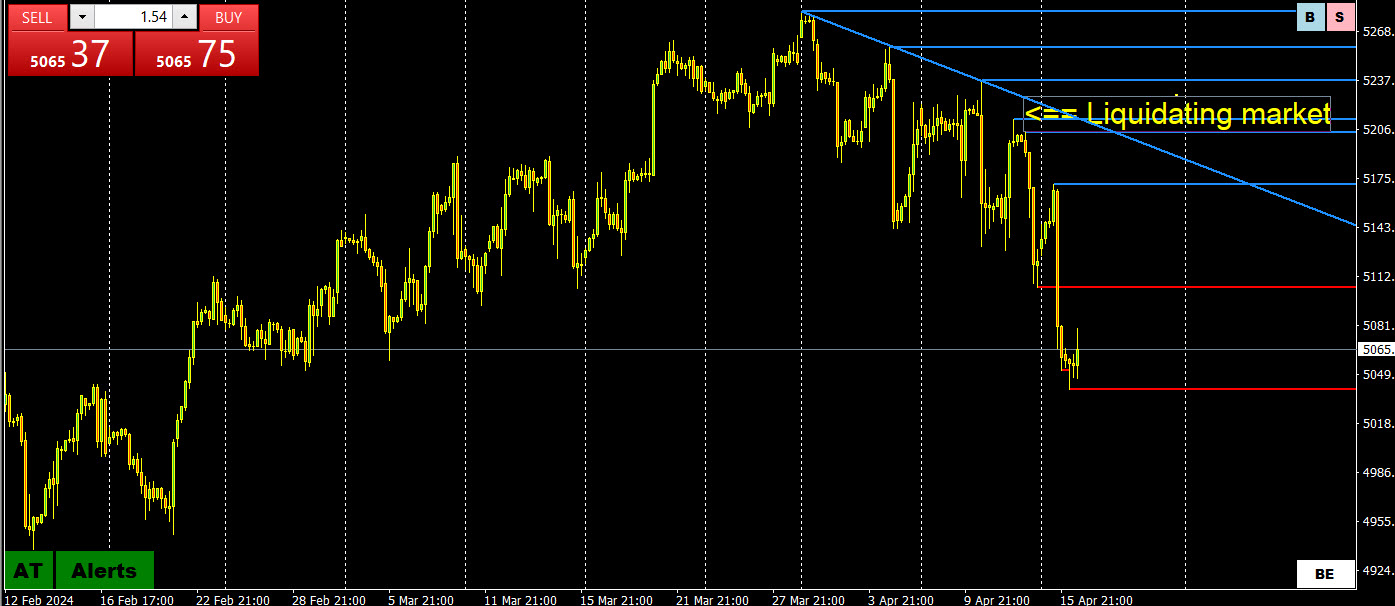
I was asked the following question, I have seen you use the term “liquidating market” and my question is how do you define it and how do you trade it? What is a liquidating market? A liquidating...

Pivot points don’t hold on forever. There comes a time when the market moves beyond the pivot points that you see, just like the market moves past resistance and support points at times as well. This is...
How to Calculate Pivot Points? Pivot points are calculated by taking the previous session’s open, close, high, and low points. This is a little confusing for some people because they know that the market is a 24-hour...
As I noted in Forex Trading: Seeking the Path of Least Resistance – A Common Sense Way ti Trade The forex market is on a constant search for the path of least resistance, whether it be on the...
An Introduction to Pivot Points in Trading Professional traders who are interested in discovering where a currency pair is likely to pivot from its current trajectory and head in another direction often use what is known as...

This is an important tip as it is easy to fall victim to it and harder to avoid. This is a trap almost all traders have fallen into at one time or another. I know when I...
Knowing your chart patterns in trading is important, but there are a lot of them! It can feel a little overwhelming at first as you try to work your way through fguring out which patterns you really...
Price doesn’t always just move up and down in trends constantly. There are times when price seems to condense into a smaller and smaller range. When this happens, you may be witnessing the beginning of a triangle...
Trading bearish and bullish pennants can provide you with yet another way to earn some extra profts on your trades. You don’t want to rely too much on any one signal or indicator, and that is why...
A rectangle chart pattern may appear if a pair continues to bounce between a high and a low over and over again. When it bounces back and forth like this, the trend lines can start to take...
Showing 97–108 of 137 posts